Listen to the measured error bands
Open the interactive listening report →: original, full-decode control and independently windowed reconstructions for every codec, dataset, metric and positive-error band. The listening ladder holds one source per dataset fixed across every comparison. Its displayed percentages are individual clip increases, not the pooled confidence-bound thresholds below.
Answer at a 50% added-error budget
The table gives the smallest measured window whose upper 95% confidence bound is at most 50%, and for which all larger measured windows also pass. A temporal frame carries one ID from every codebook. Scalar IDs are the number of codebook indices delivered in that window.
| Codec | Metric | Frames | Scalar IDs | ms | Mean increase % | 95% CI % | Clips |
|---|
| Descript DAC | MR-STFT | 7 | 63 | 81.3 | 45.0 | [41.0, 49.3] | 60 |
| Descript DAC | Log-mel L1 | 14 | 126 | 162.5 | 46.3 | [43.4, 49.6] | 60 |
| Descript DAC | Log1p-mel L1 | 17 | 153 | 197.4 | 45.6 | [42.4, 49.3] | 60 |
| Fish 400M MorePitchLoss1 | MR-STFT | 3 | 30 | 139.3 | 42.5 | [38.9, 46.3] | 60 |
| Fish 400M MorePitchLoss1 | Log-mel L1 | 4 | 40 | 185.8 | 39.4 | [36.9, 42.2] | 60 |
| Fish 400M MorePitchLoss1 | Log1p-mel L1 | 6 | 60 | 278.6 | 42.3 | [38.2, 46.8] | 60 |
| Fish DAC S2-Pro | MR-STFT | 31 | 310 | 1439.6 | 43.1 | [37.8, 48.6] | 60 |
| Fish DAC S2-Pro | Log-mel L1 | 31 | 310 | 1439.6 | 43.0 | [38.7, 47.7] | 60 |
| Fish DAC S2-Pro | Log1p-mel L1 | 76 | 760 | 3529.4 | 39.4 | [32.0, 47.9] | 55 |
| Qwen3-TTS 12Hz | MR-STFT | 4 | 64 | 320.0 | 42.9 | [38.8, 47.3] | 60 |
| Qwen3-TTS 12Hz | Log-mel L1 | 6 | 96 | 480.0 | 45.7 | [41.7, 49.9] | 60 |
| Qwen3-TTS 12Hz | Log1p-mel L1 | 15 | 240 | 1200.0 | 39.8 | [32.5, 48.1] | 60 |
A 50% increase refers to the numeric reconstruction error. It does not mean a 50% loss in perceived quality. Each codec is compared with its own full-decode baseline; absolute errors also appear below so that a weak baseline cannot be mistaken for a better codec.
One window that satisfies all three metrics
For the pooled sample, take the largest of the three conservative 50% thresholds. This gives one measured window size that stays within the budget across all three metrics under the stated rule.
| Codec | Minimum temporal frames | Scalar codebook IDs | Window duration (ms) |
|---|
| Descript DAC | 17 | 153 | 197.4 |
| Fish 400M MorePitchLoss1 | 6 | 60 | 278.6 |
| Fish DAC S2-Pro | 76 | 760 | 3529.4 |
| Qwen3-TTS 12Hz | 15 | 240 | 1200.0 |
How to compare these results
Compare both temporal frame counts and durations. Each Fish frame spans four times as much audio as a Descript frame. The joint thresholds above therefore measure different durations even when one codec uses fewer frames.
The full-decode baselines matter. Pooled MR-STFT baseline errors are Descript DAC: 0.987, Fish 400M MorePitchLoss1: 1.162, Fish DAC S2-Pro: 0.980, Qwen3-TTS 12Hz: 1.108. Relative tolerance to windowing describes context sensitivity rather than establishing the best absolute reconstruction quality.
The strict 5% upper-confidence-bound criterion is not established for S2-Pro in the tested sweep. The longest partial-window conditions include only the longest eligible clips. These unresolved results are retained rather than inferring an unmeasured cutoff.
Joint thresholds across the full error-budget range
Each cell satisfies the conservative threshold rule for MR-STFT, log-mel and log1p-mel together.
| Budget % | Descript DAC | Fish 400M MorePitchLoss1 | Fish DAC S2-Pro | Qwen3-TTS 12Hz |
|---|
| 5 | 160 frames / 1857.6 ms | 49 frames / 2275.6 ms | not established | 189 frames / 15120.0 ms |
| 10 | 84 frames / 975.2 ms | 25 frames / 1161.0 ms | 384 frames / 17832.9 ms | 123 frames / 9840.0 ms |
| 20 | 43 frames / 499.2 ms | 15 frames / 696.6 ms | 251 frames / 11656.4 ms | 48 frames / 3840.0 ms |
| 30 | 29 frames / 336.7 ms | 10 frames / 464.4 ms | 138 frames / 6408.7 ms | 31 frames / 2480.0 ms |
| 40 | 22 frames / 255.4 ms | 8 frames / 371.5 ms | 90 frames / 4179.6 ms | 23 frames / 1840.0 ms |
| 50 | 17 frames / 197.4 ms | 6 frames / 278.6 ms | 76 frames / 3529.4 ms | 15 frames / 1200.0 ms |
Shared sample and model geometry
| Codec | Sample rate | Frames/s | Codebooks | ms/frame |
|---|
| Descript DAC | 44100 | 86.133 | 9 | 11.610 |
| Fish 400M MorePitchLoss1 | 44100 | 21.533 | 10 | 46.440 |
| Fish DAC S2-Pro | 44100 | 21.533 | 10 | 46.440 |
| Qwen3-TTS 12Hz | 24000 | 12.500 | 16 | 80.000 |
All models use the same 60 clips across Cartoon Voices, LibriSpeech Other 500, and Podcast 800. Selection uses seed 20260928; the default 20-clips-per-dataset sample matches the preceding Fish window experiment. All codebooks are retained. Clips are downmixed to mono and resampled to the codec rate without normalization.
Qwen tokenizer: native geometry and decoder controls
Qwen/Qwen3-TTS-Tokenizer-12Hz is the audio tokenizer, not a text-to-speech language model. Despite its name, its native temporal rate is 12.5 frames/s: 1,920 samples per frame at 24 kHz, or 80 ms. Each frame contains 16 discrete codebook IDs. This study retains every book and uses the pinned checkpoint and implementation.
The public Qwen decode helper normally splits long code sequences into 300-frame chunks with 25 frames of left context. That policy is not an independent-window experiment. Here the underlying model.decoder(codes) receives the complete tensor for the control and independent tensors for the treatments, with no shared context. Its eight-layer transformer has a per-layer 72-frame sliding window (5.76 s); this does not itself determine a safe measured cutoff.
Native durations, not nominal model names or scalar index counts, must be compared: a Qwen frame spans 80 ms, a Fish frame 46.44 ms, and a Descript frame 11.61 ms. Codebook sizes in the measured registry: [2048, 2048, 2048, 2048, 2048, 2048, 2048, 2048, 2048, 2048, 2048, 2048, 2048, 2048, 2048, 2048].
Sources: official HF model and the pinned Qwen implementation recorded in the protocol.
Qwen decoder size and measured CPU/GPU throughput
The deployed Qwen decoder contains 114.323 million parameters; the full encoder-plus-decoder contains 153.715 million. Counts include frozen codebook lookup parameters, not only trainable weights.
| Device | Batch | Frames | Decoded seconds | Median decode ms | × realtime | Observed min–max × |
|---|
| cuda | 1 | 109 | 8.72 | 51.97 | 167.80 | 165.42–168.76 |
| cpu | 1 | 109 | 8.72 | 2944.68 | 2.96 | 2.88–3.10 |
Batch-one decoding of one real Podcast clip; three warmup calls and ten measured calls per device. CUDA timing synchronizes before and after each call. This measures discrete lookup plus direct waveform decoding, excluding encoding, resampling, disk IO, model loading and metrics. GPU: NVIDIA L40S; CPU: 4 Torch threads. Both use FP32 and eager attention; TF32 is disabled. Observed min–max ranges describe repeat timing variability, not confidence intervals or performance guarantees on other clips/hardware.
All 16 codebooks have 2,048 entries: 176 fixed-width bits per frame, 2.2 kb/s, or 0.99 MB per hour of audio as an ideal bit-packed token payload (decimal MB, no headers, padding or entropy coding). Cached int64 tensors in this experiment instead use 5.76 MB/hour before serialization overhead; those files are not a packed codec format.
Actual package versions: torch 2.12.0+cu130, torchaudio 2.11.0a0+4e3e282, transformers 4.57.6, accelerate 1.12.0, qwen-tts 0.1.1, onnxruntime 1.30.0. The existing Torch installation was preserved. GPU checks verified finite reconstruction, all-book integer lookup geometry, and independent one-frame decode. The maximum difference between three distinct eight-frame windows decoded together and separately was 2.1e-06.
Full-roundtrip quality in the benchmark workbench
A separate normal workbench run evaluates all four codecs on exactly the same 60 checked source IDs: 240 successful full roundtrips, with no failed or missing metrics. Run ID: 0b4452295400. Reconstructions are saved for playback and comparison in the workbench. The following values are unweighted means of 20 clips per dataset, not decoder-window deterioration percentages.
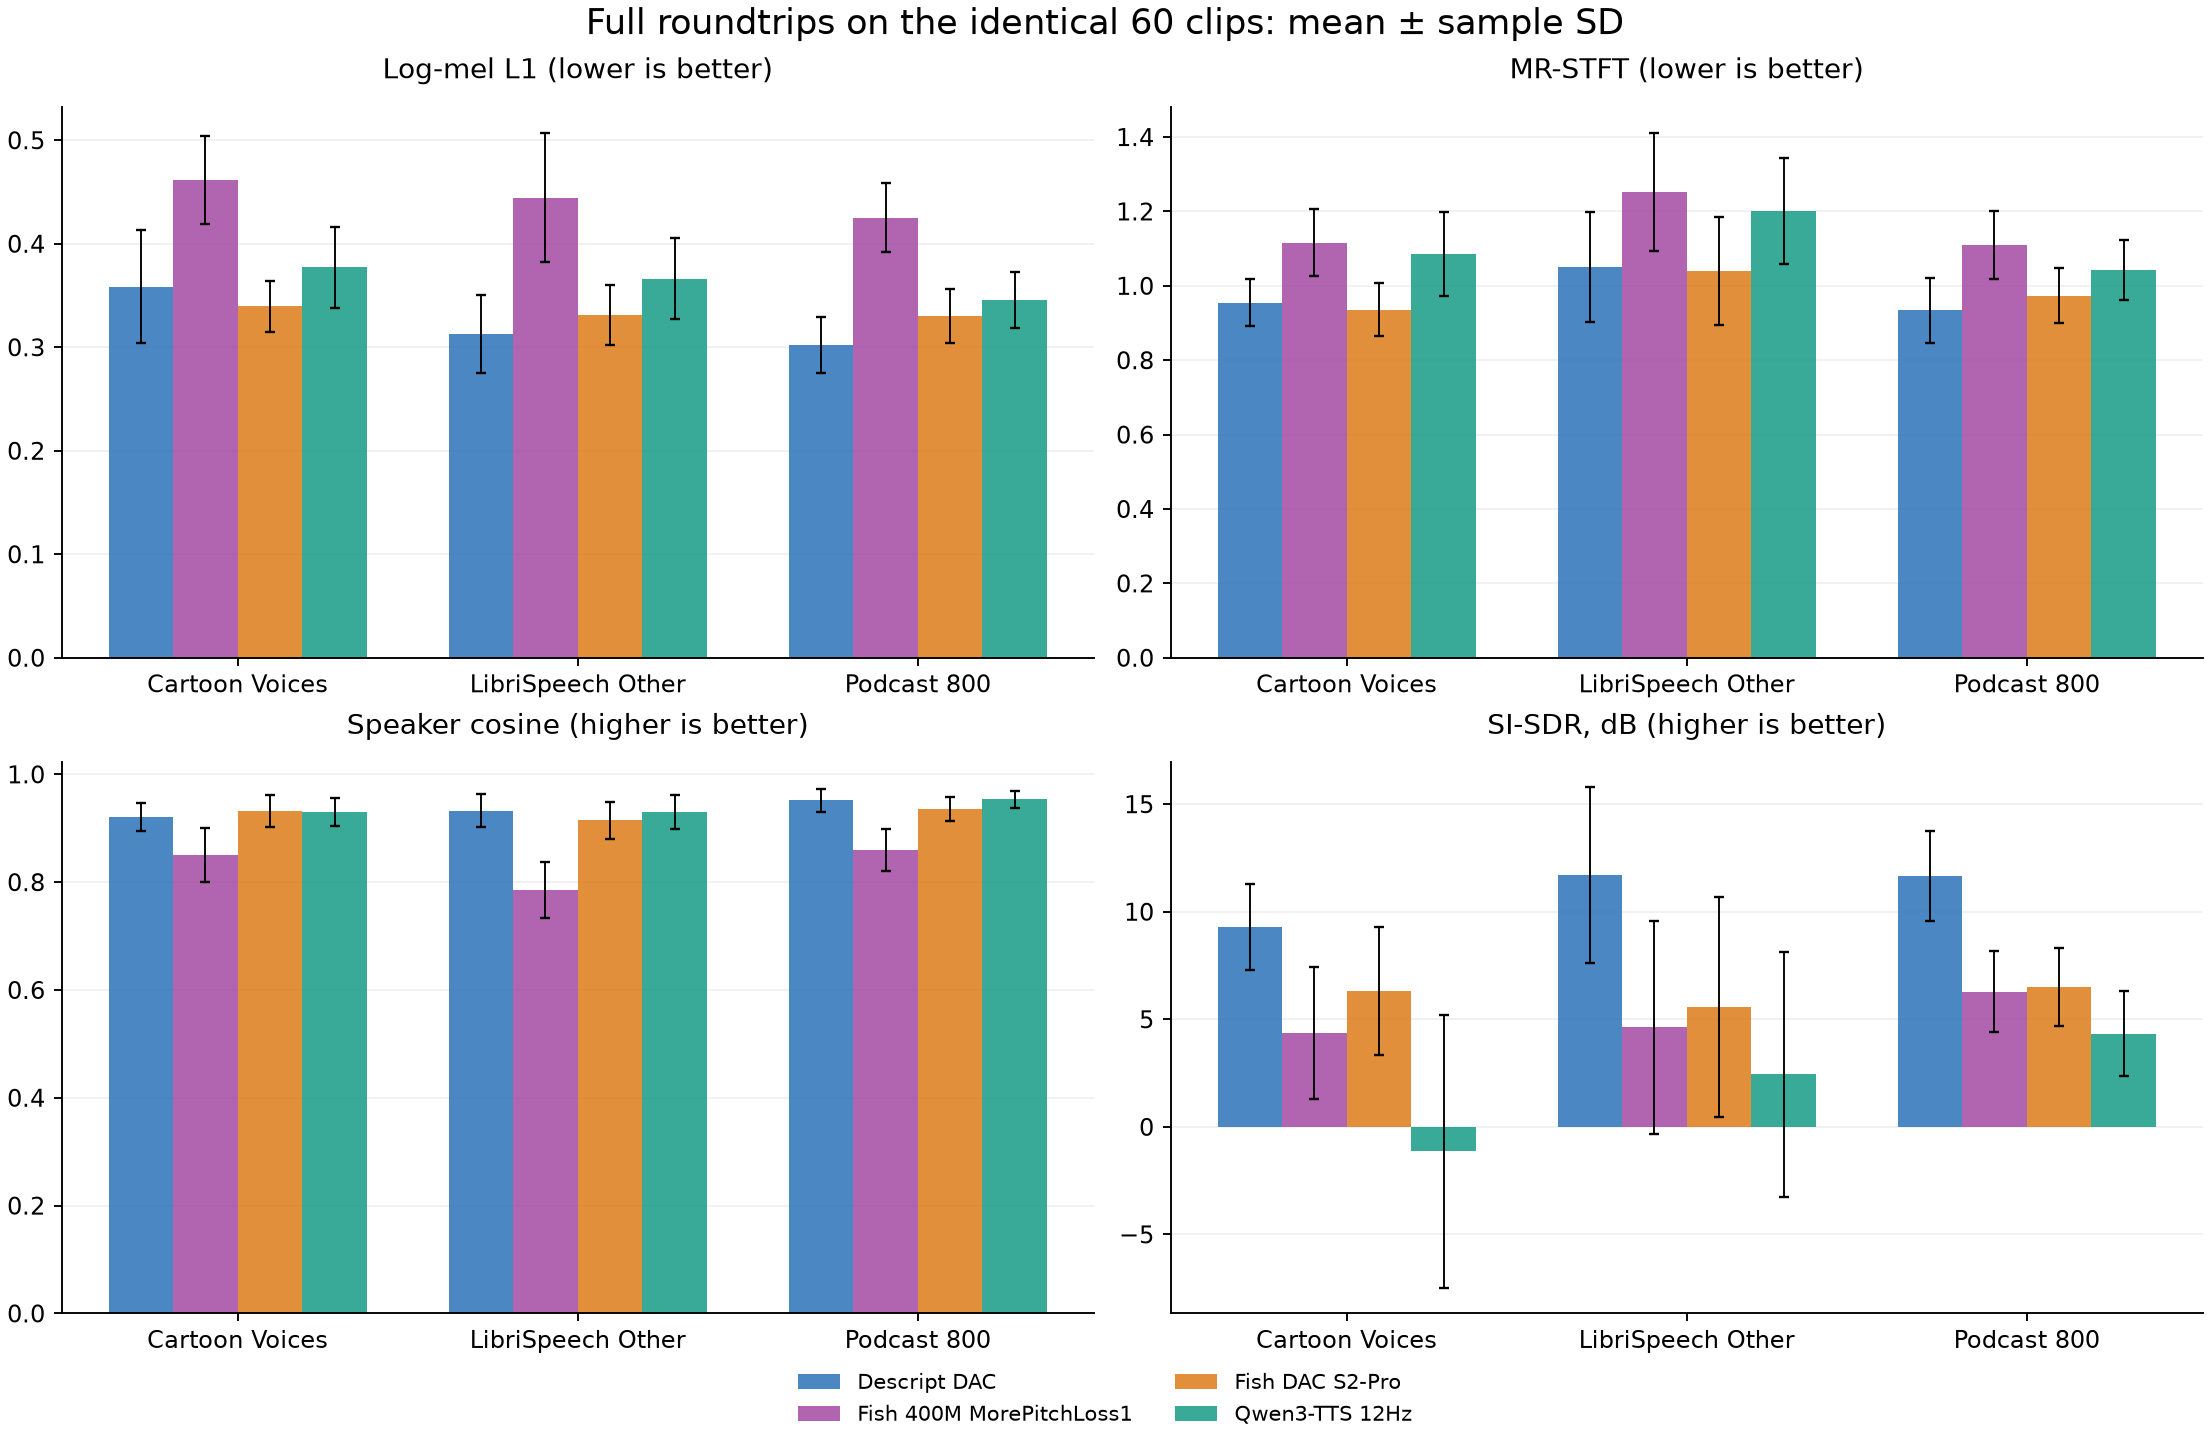 Full roundtrip means; error bars show clip-to-clip sample standard deviation, not confidence intervals.
| Codec | Dataset | N | Log-mel ↓ | Mel L1 ↓ | Mel SC ↓ | MR-STFT ↓ | Speaker cosine ↑ | SI-SDR dB ↑ | SNR dB ↑ |
|---|
| Descript DAC | cartoon-voices | 20 | 0.358 | 0.0026 | 0.140 | 0.955 | 0.921 | 9.282 | 9.706 |
| Descript DAC | librispeech-other-500 | 20 | 0.313 | 0.0030 | 0.127 | 1.051 | 0.933 | 11.695 | 12.122 |
| Descript DAC | podcast-800 | 20 | 0.302 | 0.0065 | 0.111 | 0.934 | 0.952 | 11.668 | 11.945 |
| Fish 400M MorePitchLoss1 | cartoon-voices | 20 | 0.462 | 0.0039 | 0.238 | 1.116 | 0.851 | 4.358 | 5.331 |
| Fish 400M MorePitchLoss1 | librispeech-other-500 | 20 | 0.445 | 0.0055 | 0.250 | 1.252 | 0.786 | 4.639 | 5.831 |
| Fish 400M MorePitchLoss1 | podcast-800 | 20 | 0.425 | 0.0115 | 0.216 | 1.110 | 0.860 | 6.281 | 6.665 |
| Fish DAC S2-Pro | cartoon-voices | 20 | 0.340 | 0.0027 | 0.155 | 0.936 | 0.932 | 6.322 | 7.204 |
| Fish DAC S2-Pro | librispeech-other-500 | 20 | 0.331 | 0.0041 | 0.187 | 1.040 | 0.915 | 5.570 | 6.978 |
| Fish DAC S2-Pro | podcast-800 | 20 | 0.330 | 0.0089 | 0.157 | 0.973 | 0.936 | 6.503 | 7.306 |
| Qwen3-TTS 12Hz | cartoon-voices | 20 | 0.377 | 0.0034 | 0.218 | 1.086 | 0.931 | -1.141 | 2.717 |
| Qwen3-TTS 12Hz | librispeech-other-500 | 20 | 0.366 | 0.0045 | 0.206 | 1.200 | 0.930 | 2.435 | 4.662 |
| Qwen3-TTS 12Hz | podcast-800 | 20 | 0.346 | 0.0097 | 0.175 | 1.043 | 0.954 | 4.330 | 5.625 |
Speaker similarity uses SpeechBrain ECAPA-TDNN at its native 16 kHz; all other metrics use the workbench’s 24 kHz sample-zero alignment, no loudness normalization. Waveform SNR and SI-SDR are phase/timing sensitive, not MOS. Log1p-mel is reported separately throughout the controlled window study. This run contains no new ASR transcriptions or WER claims. Source hashes, runtime fixes and complete per-clip metrics are stored under data/qwen-paired-benchmark/ and the run database.
The workbench uses CPU resampling and requests deterministic Torch algorithms; the controlled window experiment uses GPU resampling and feature extraction. Their definitions and source files match, but numerical paths can produce slightly different quantized codes and absolute errors. Each window-treatment ratio uses its own measured matched full control, never the separate workbench baseline.
Relationship to the preceding Fish experiment
The earlier 62-frame result used an absolute added log-mel margin of 0.01 nat. Against that sample baseline, this is about a 2.3% increase. The present report asks a different question: how small a window can satisfy budgets from 5% to 50% in each of three errors? A much smaller window at a 50% budget is therefore consistent with the earlier result. The sample, full-encode control and independent hard-join policy are shared.
Relative deterioration and uncertainty
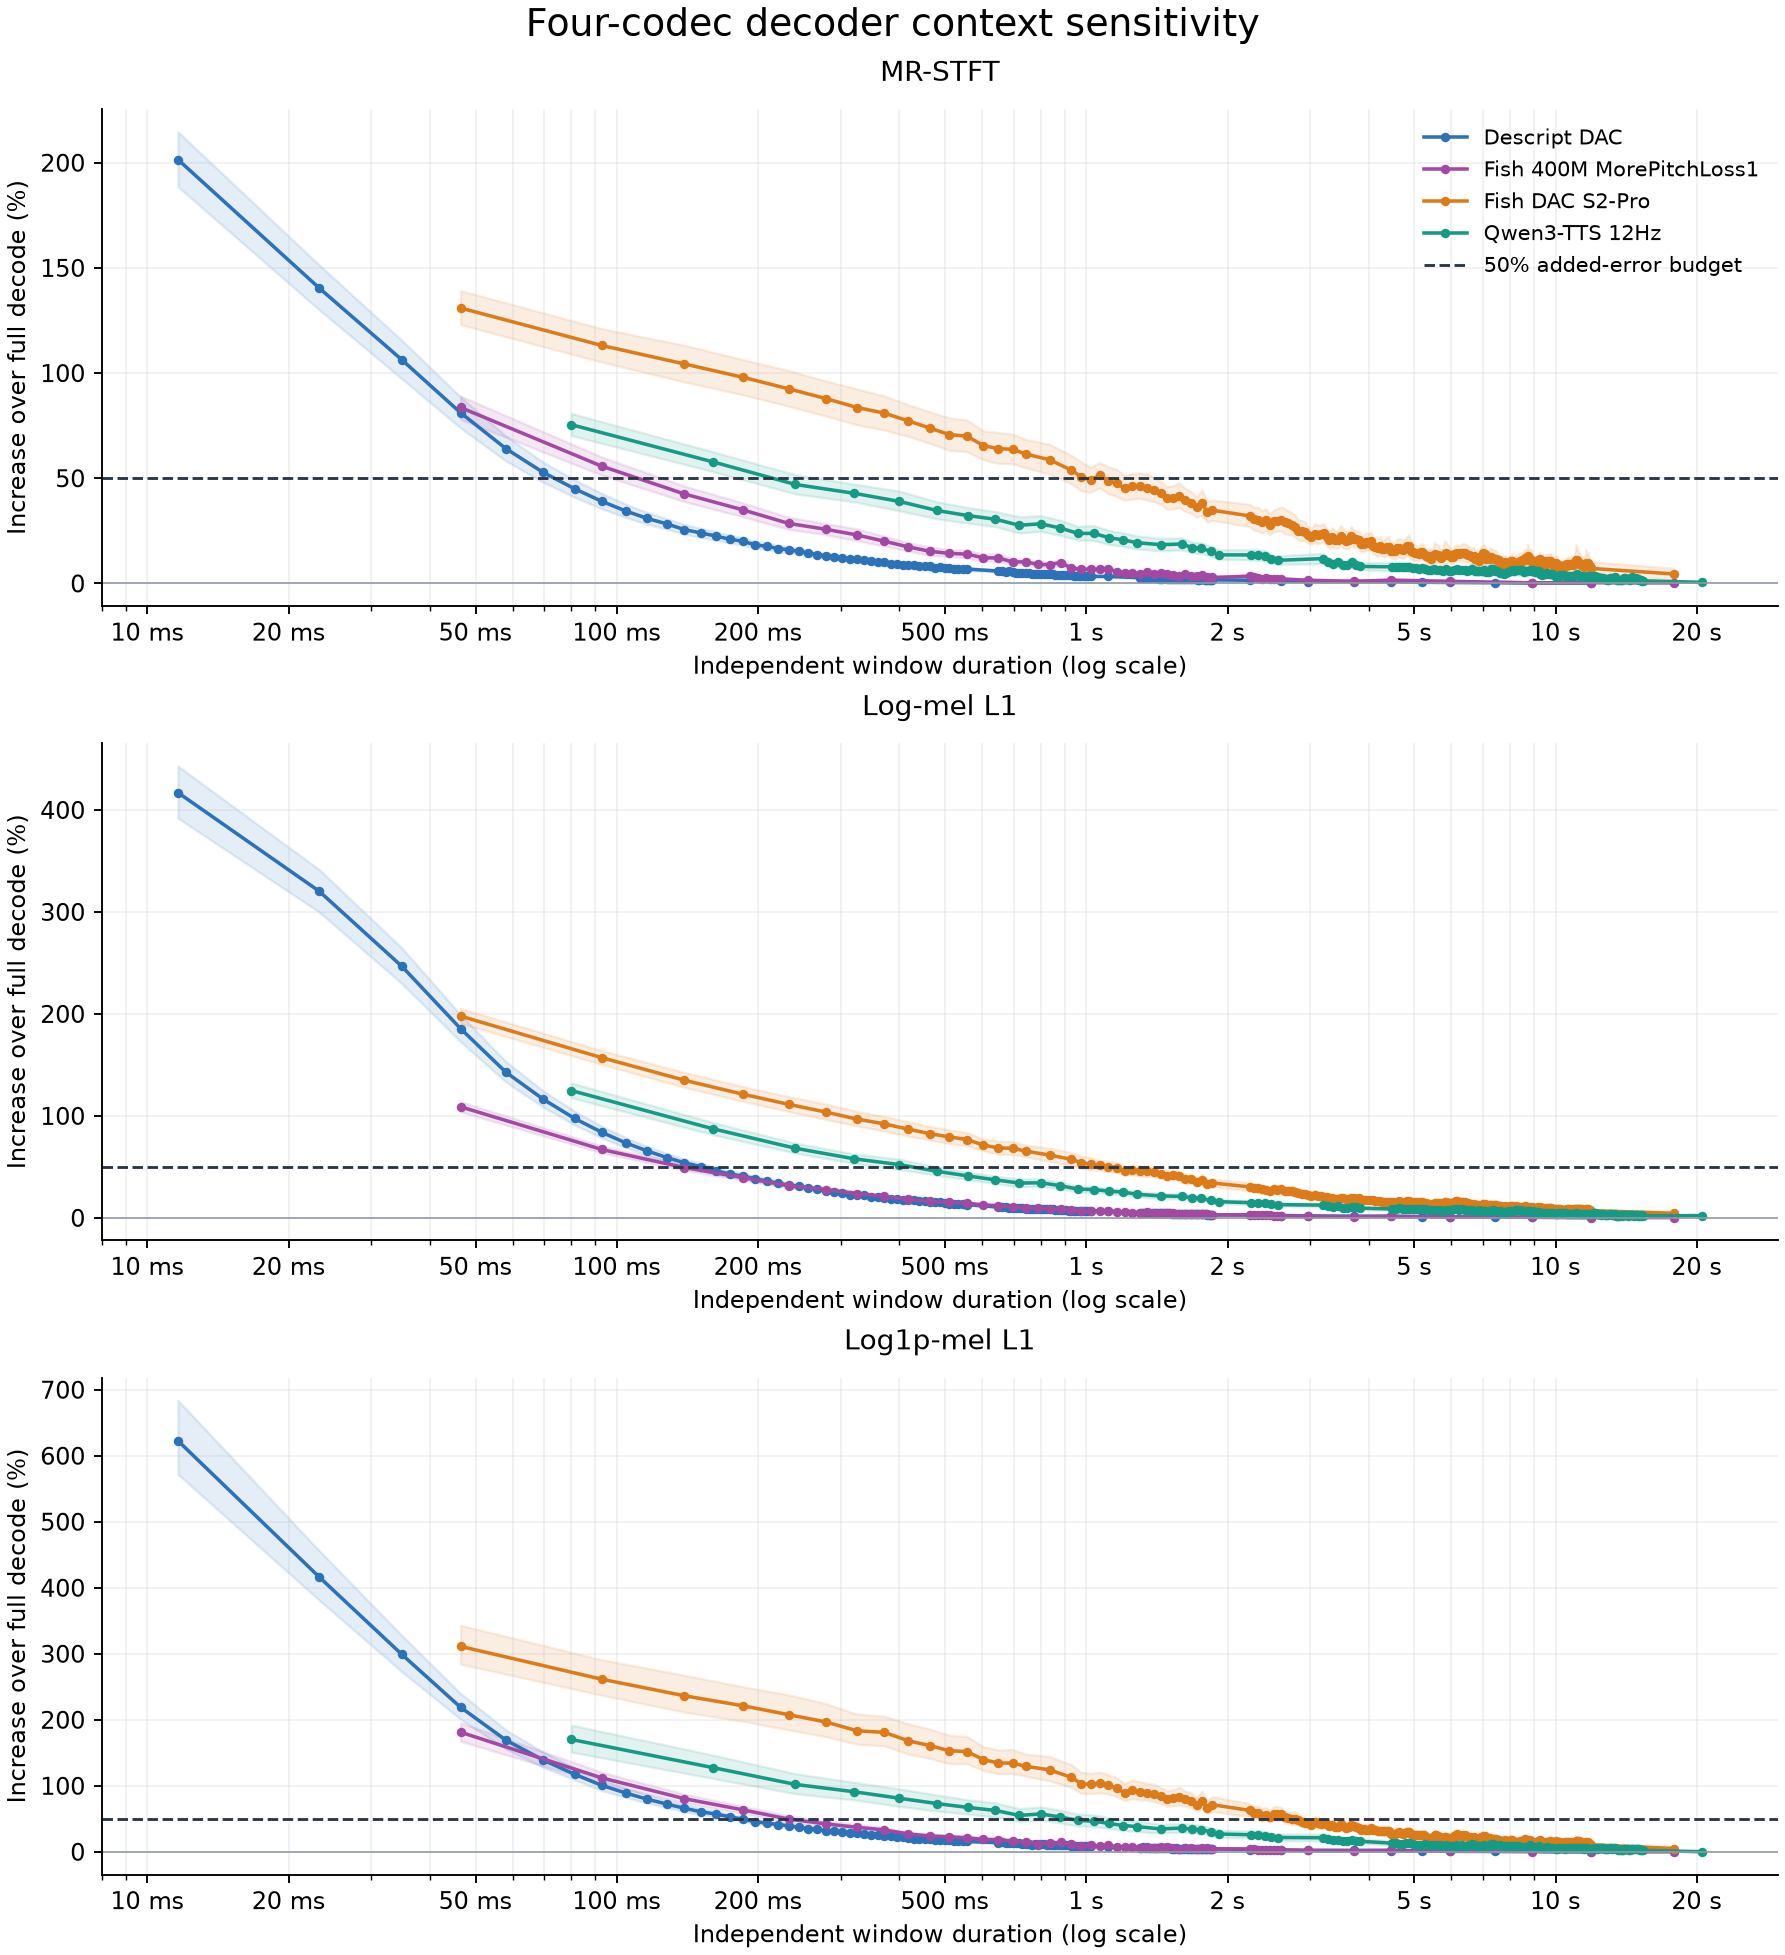 Solid lines: ratio of mean errors. Shaded bands: paired bootstrap 95% intervals. Horizontal line: 50% budget.
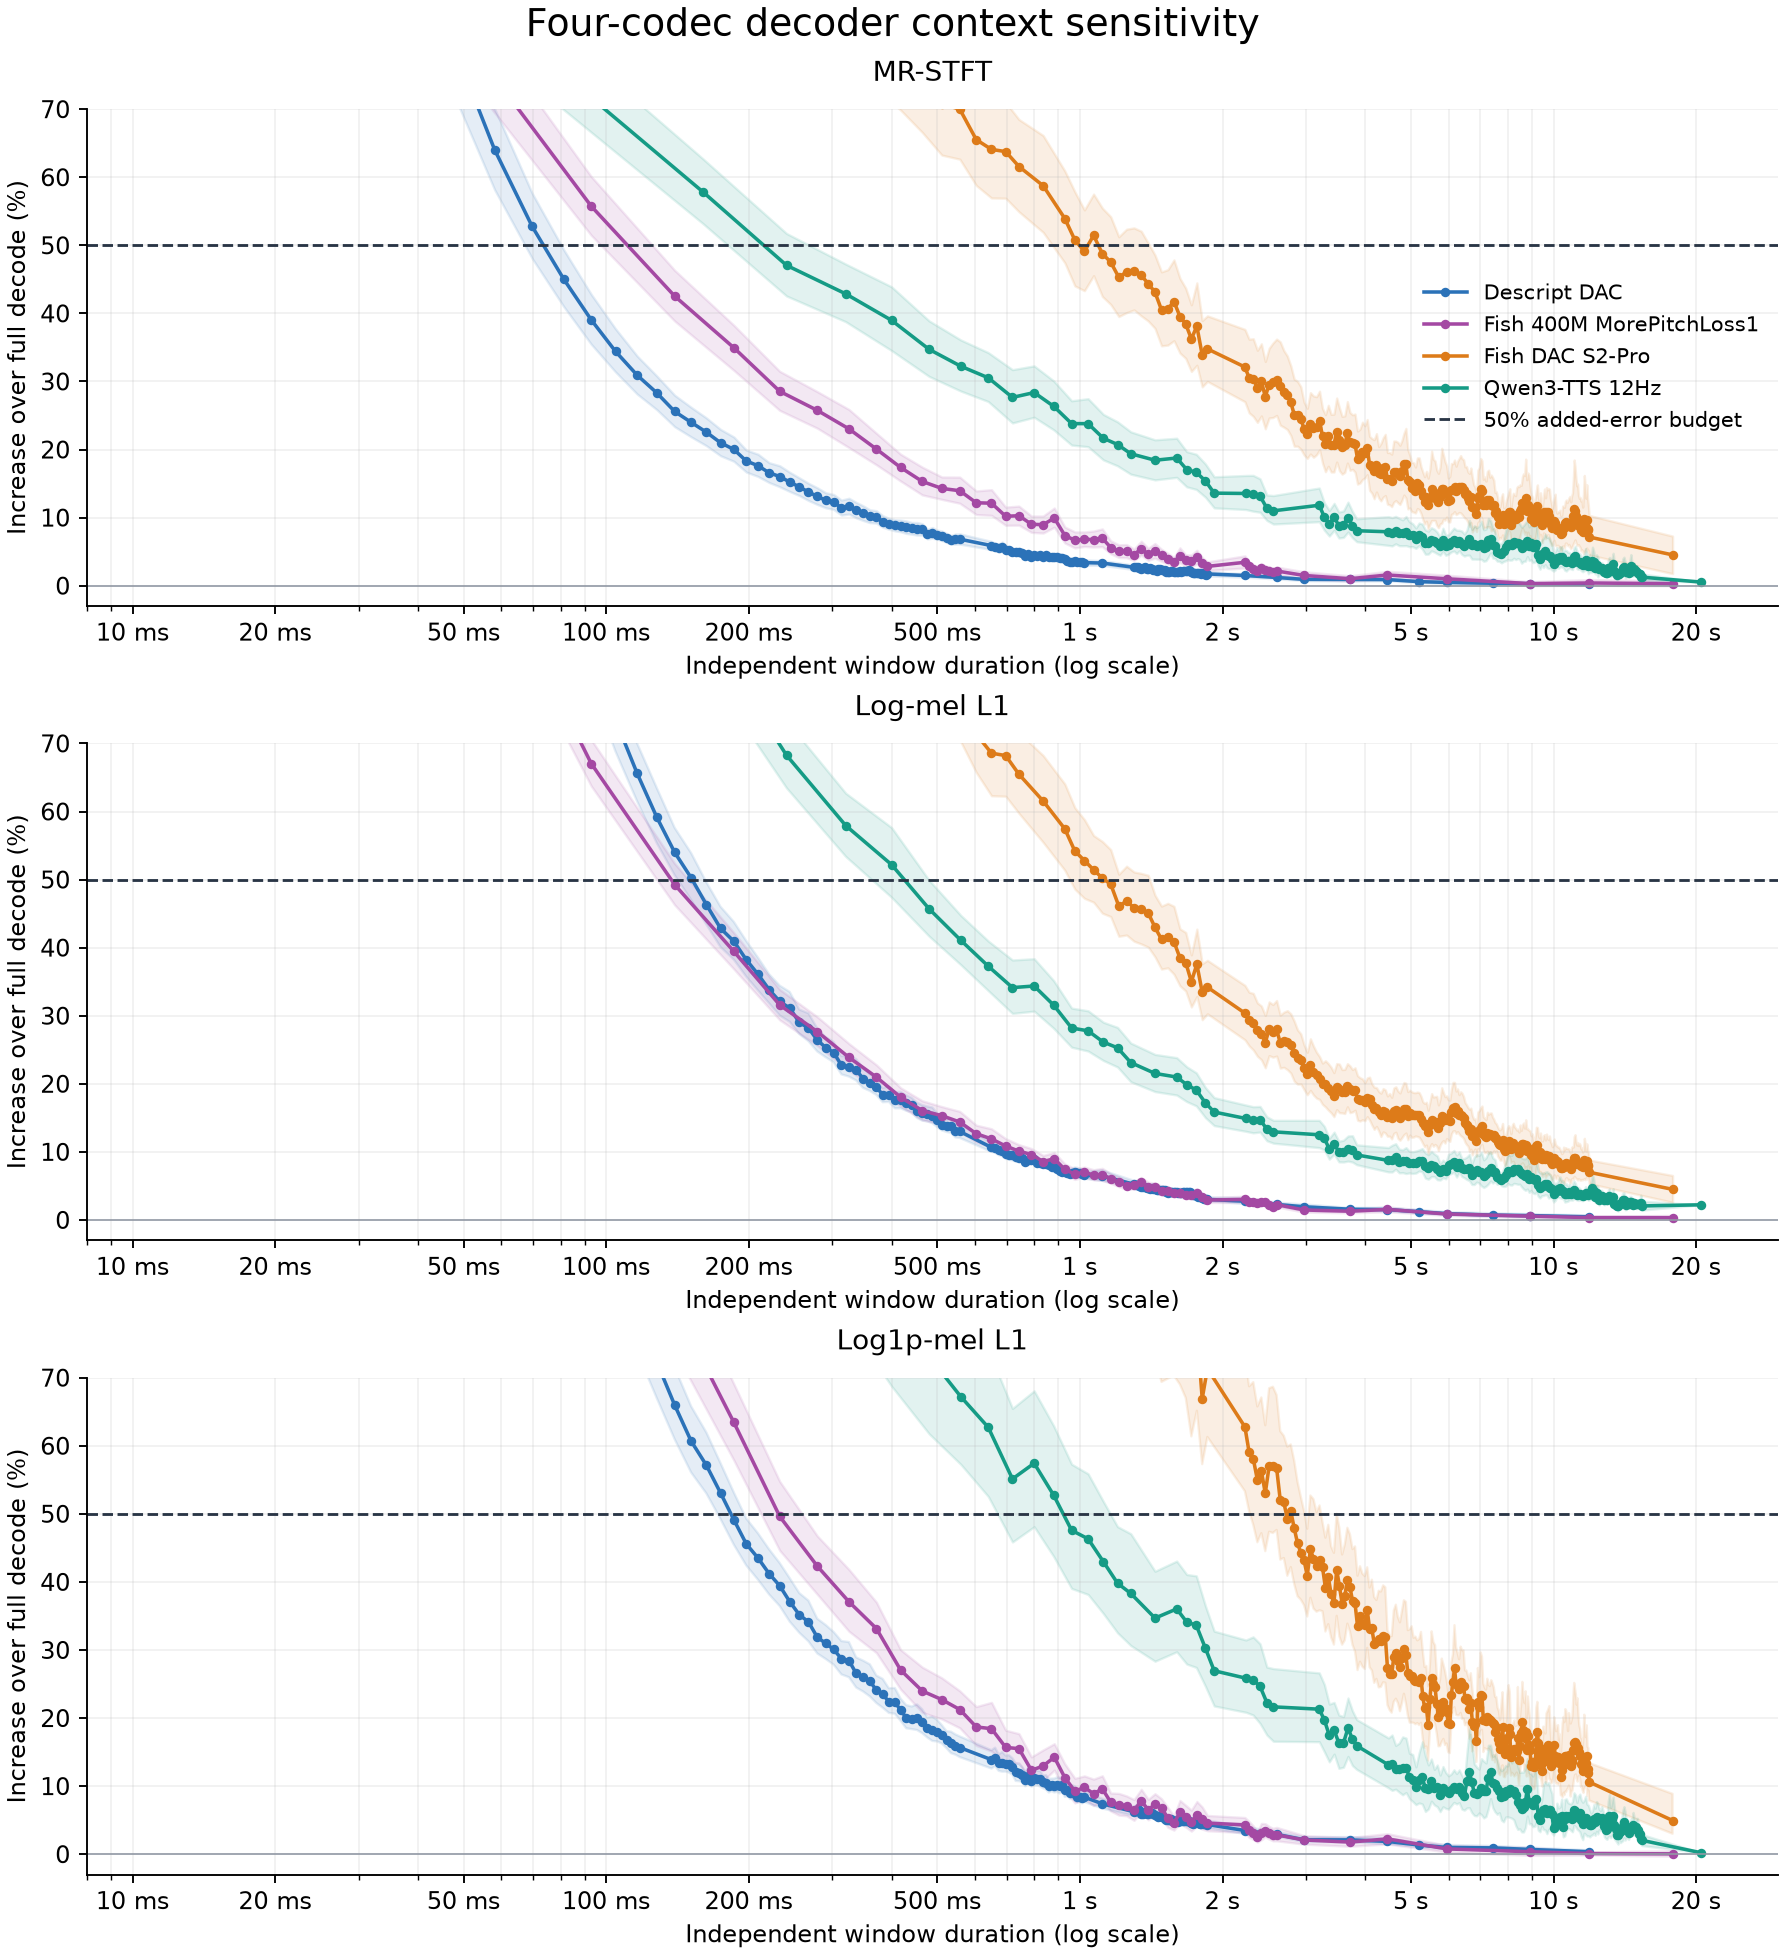 The same measurements with the vertical range focused on 0–50% decisions.
The same comparison in token counts
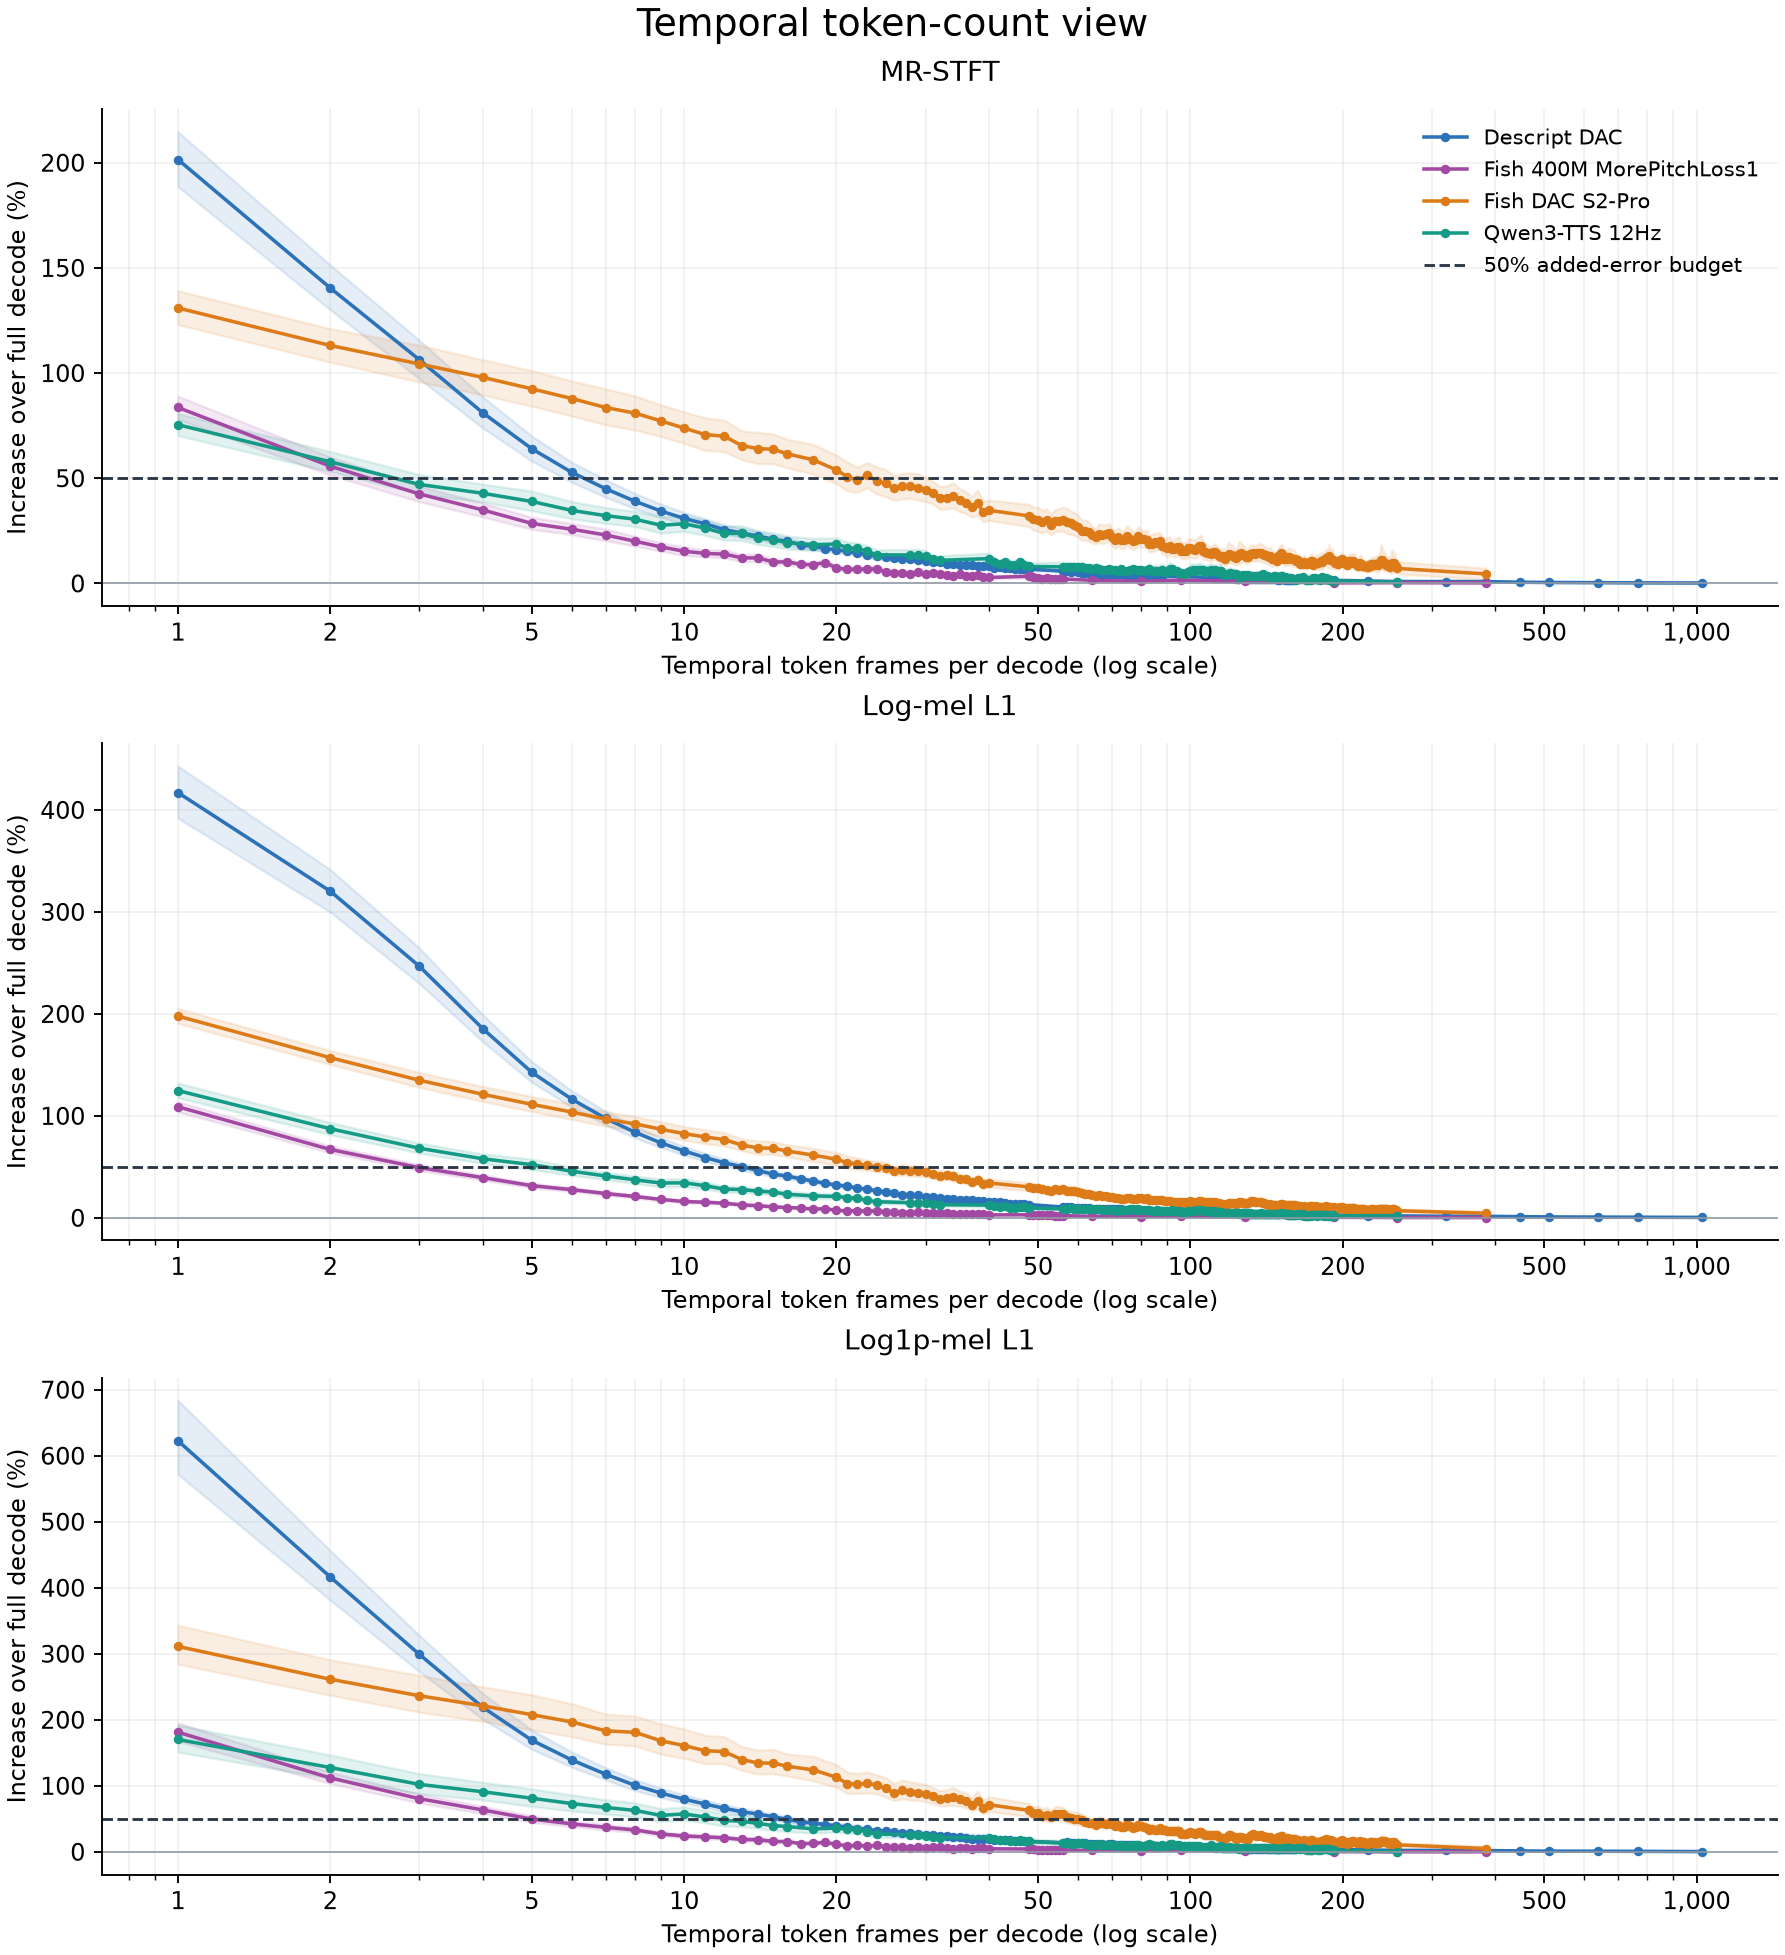 Full vertical range: ratio of mean errors, with paired bootstrap 95% bands and the 50% budget.
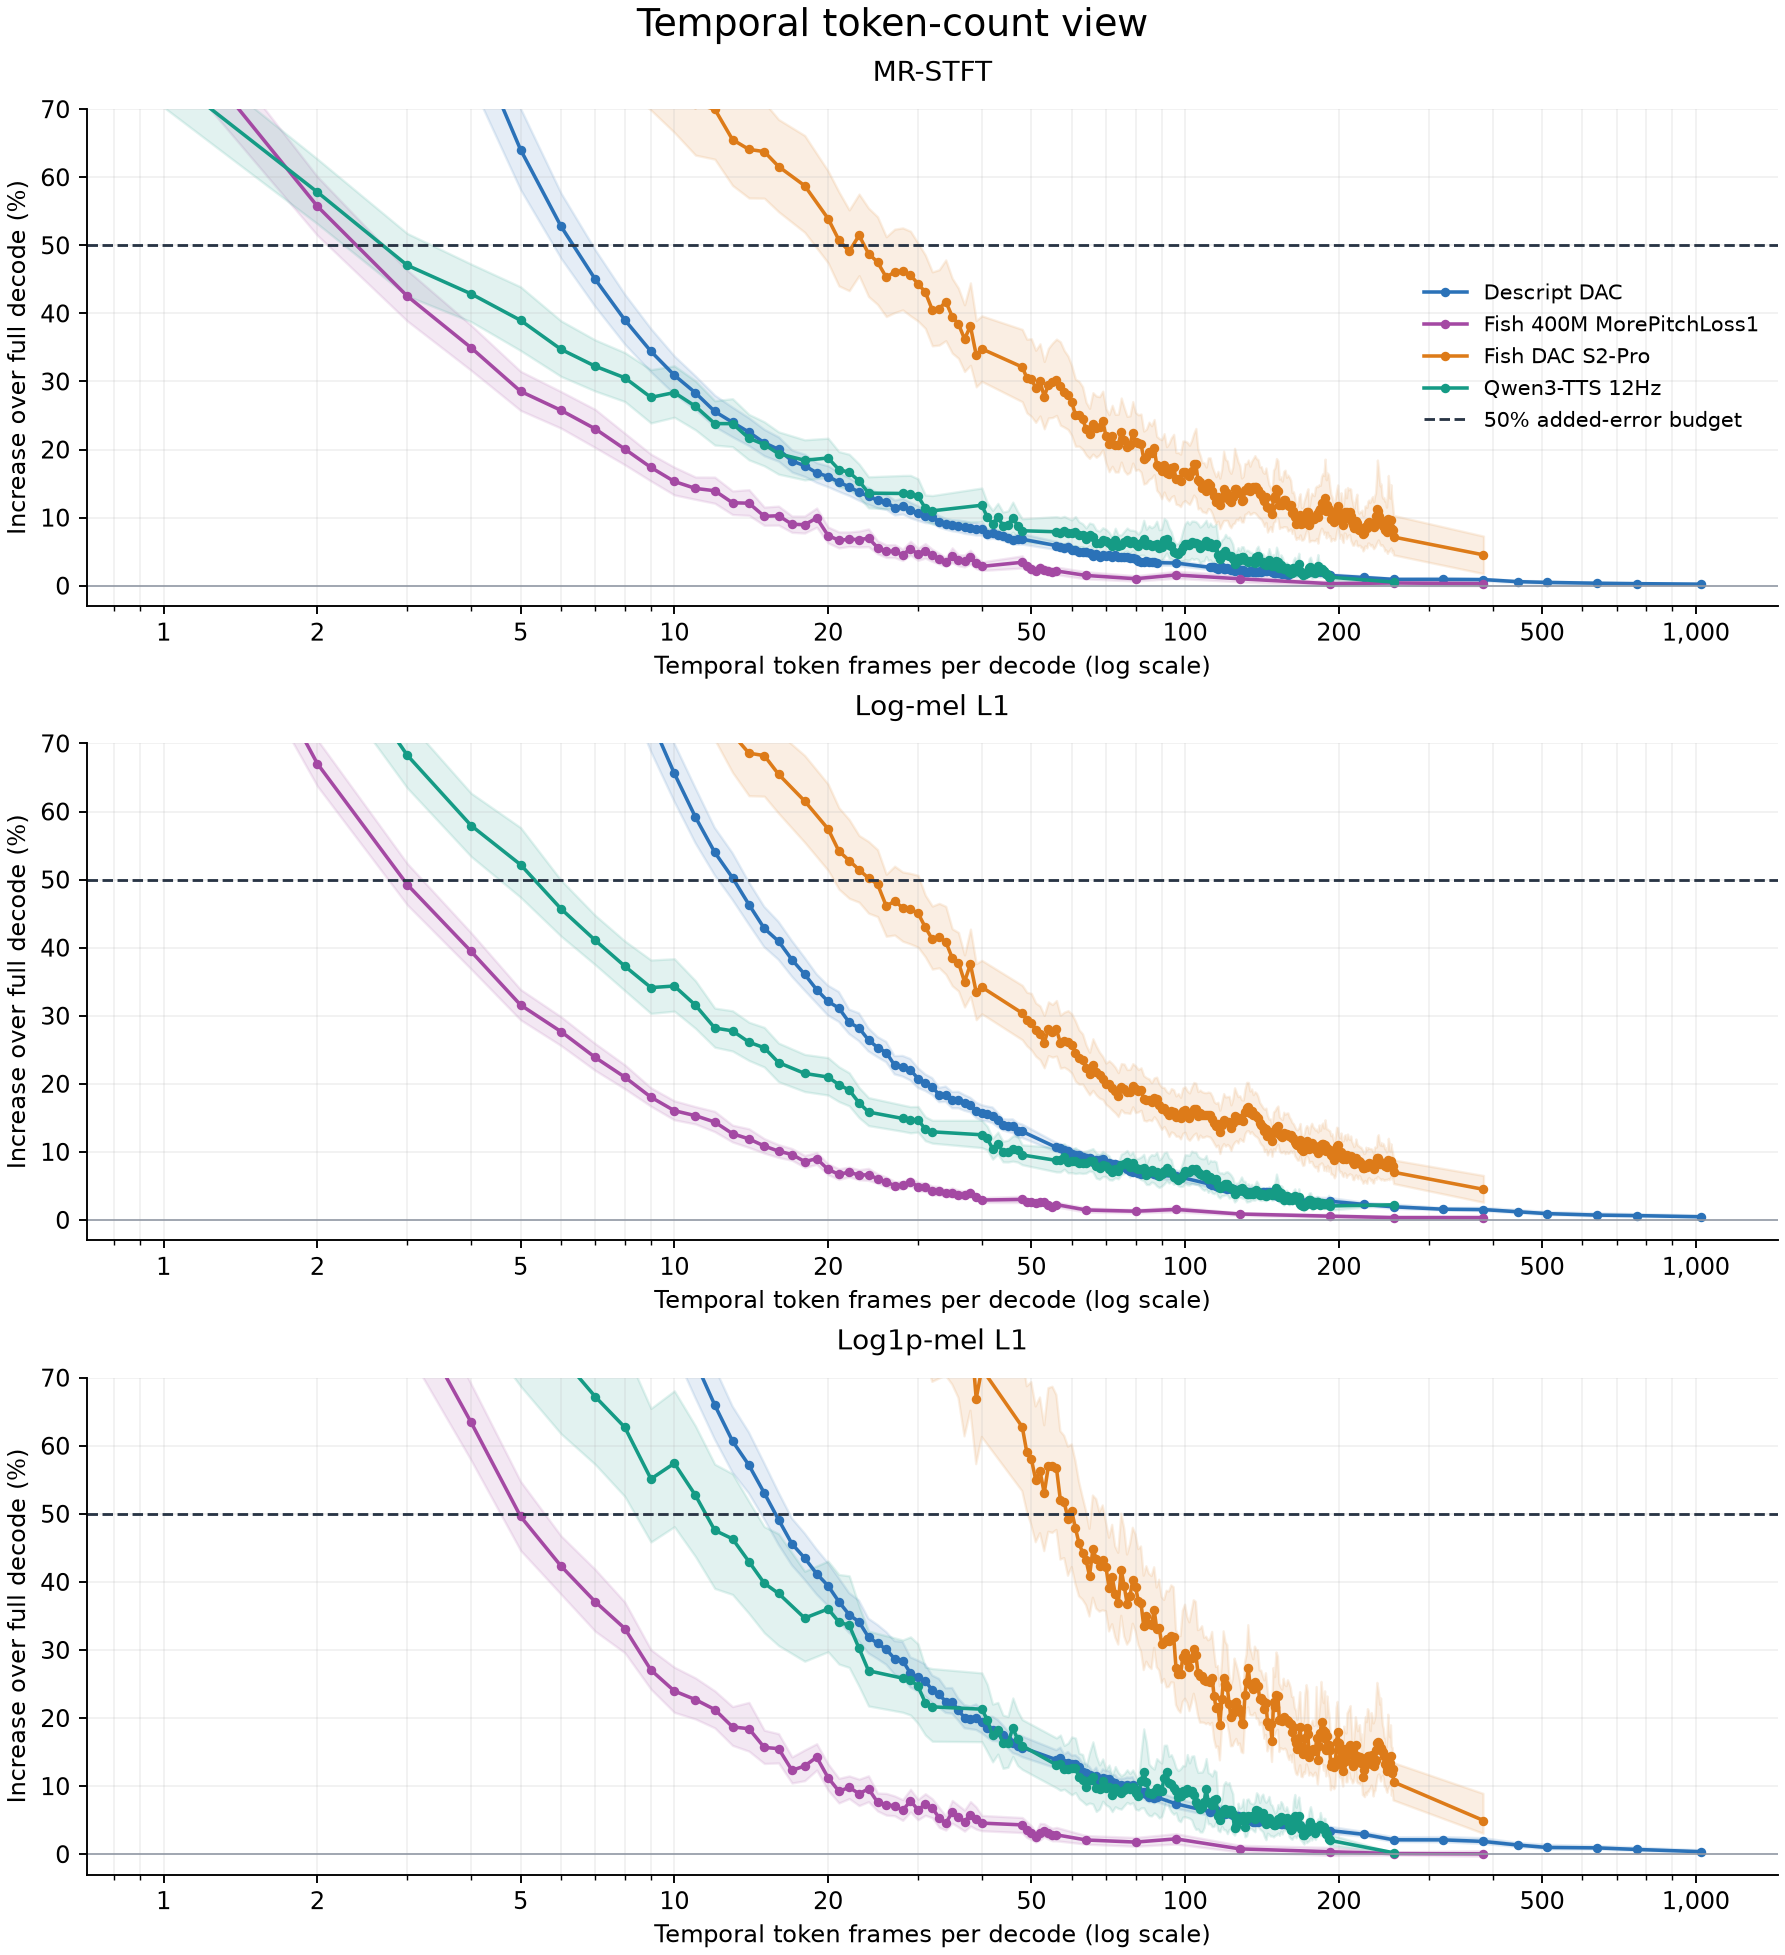 Each temporal frame is a bundle of nine IDs for Descript, ten IDs for Fish, or sixteen IDs for Qwen. Descript frames cover 11.61 ms; Fish frames cover 46.44 ms; Qwen frames cover 80 ms.
Individual codebook tokens per decoder call
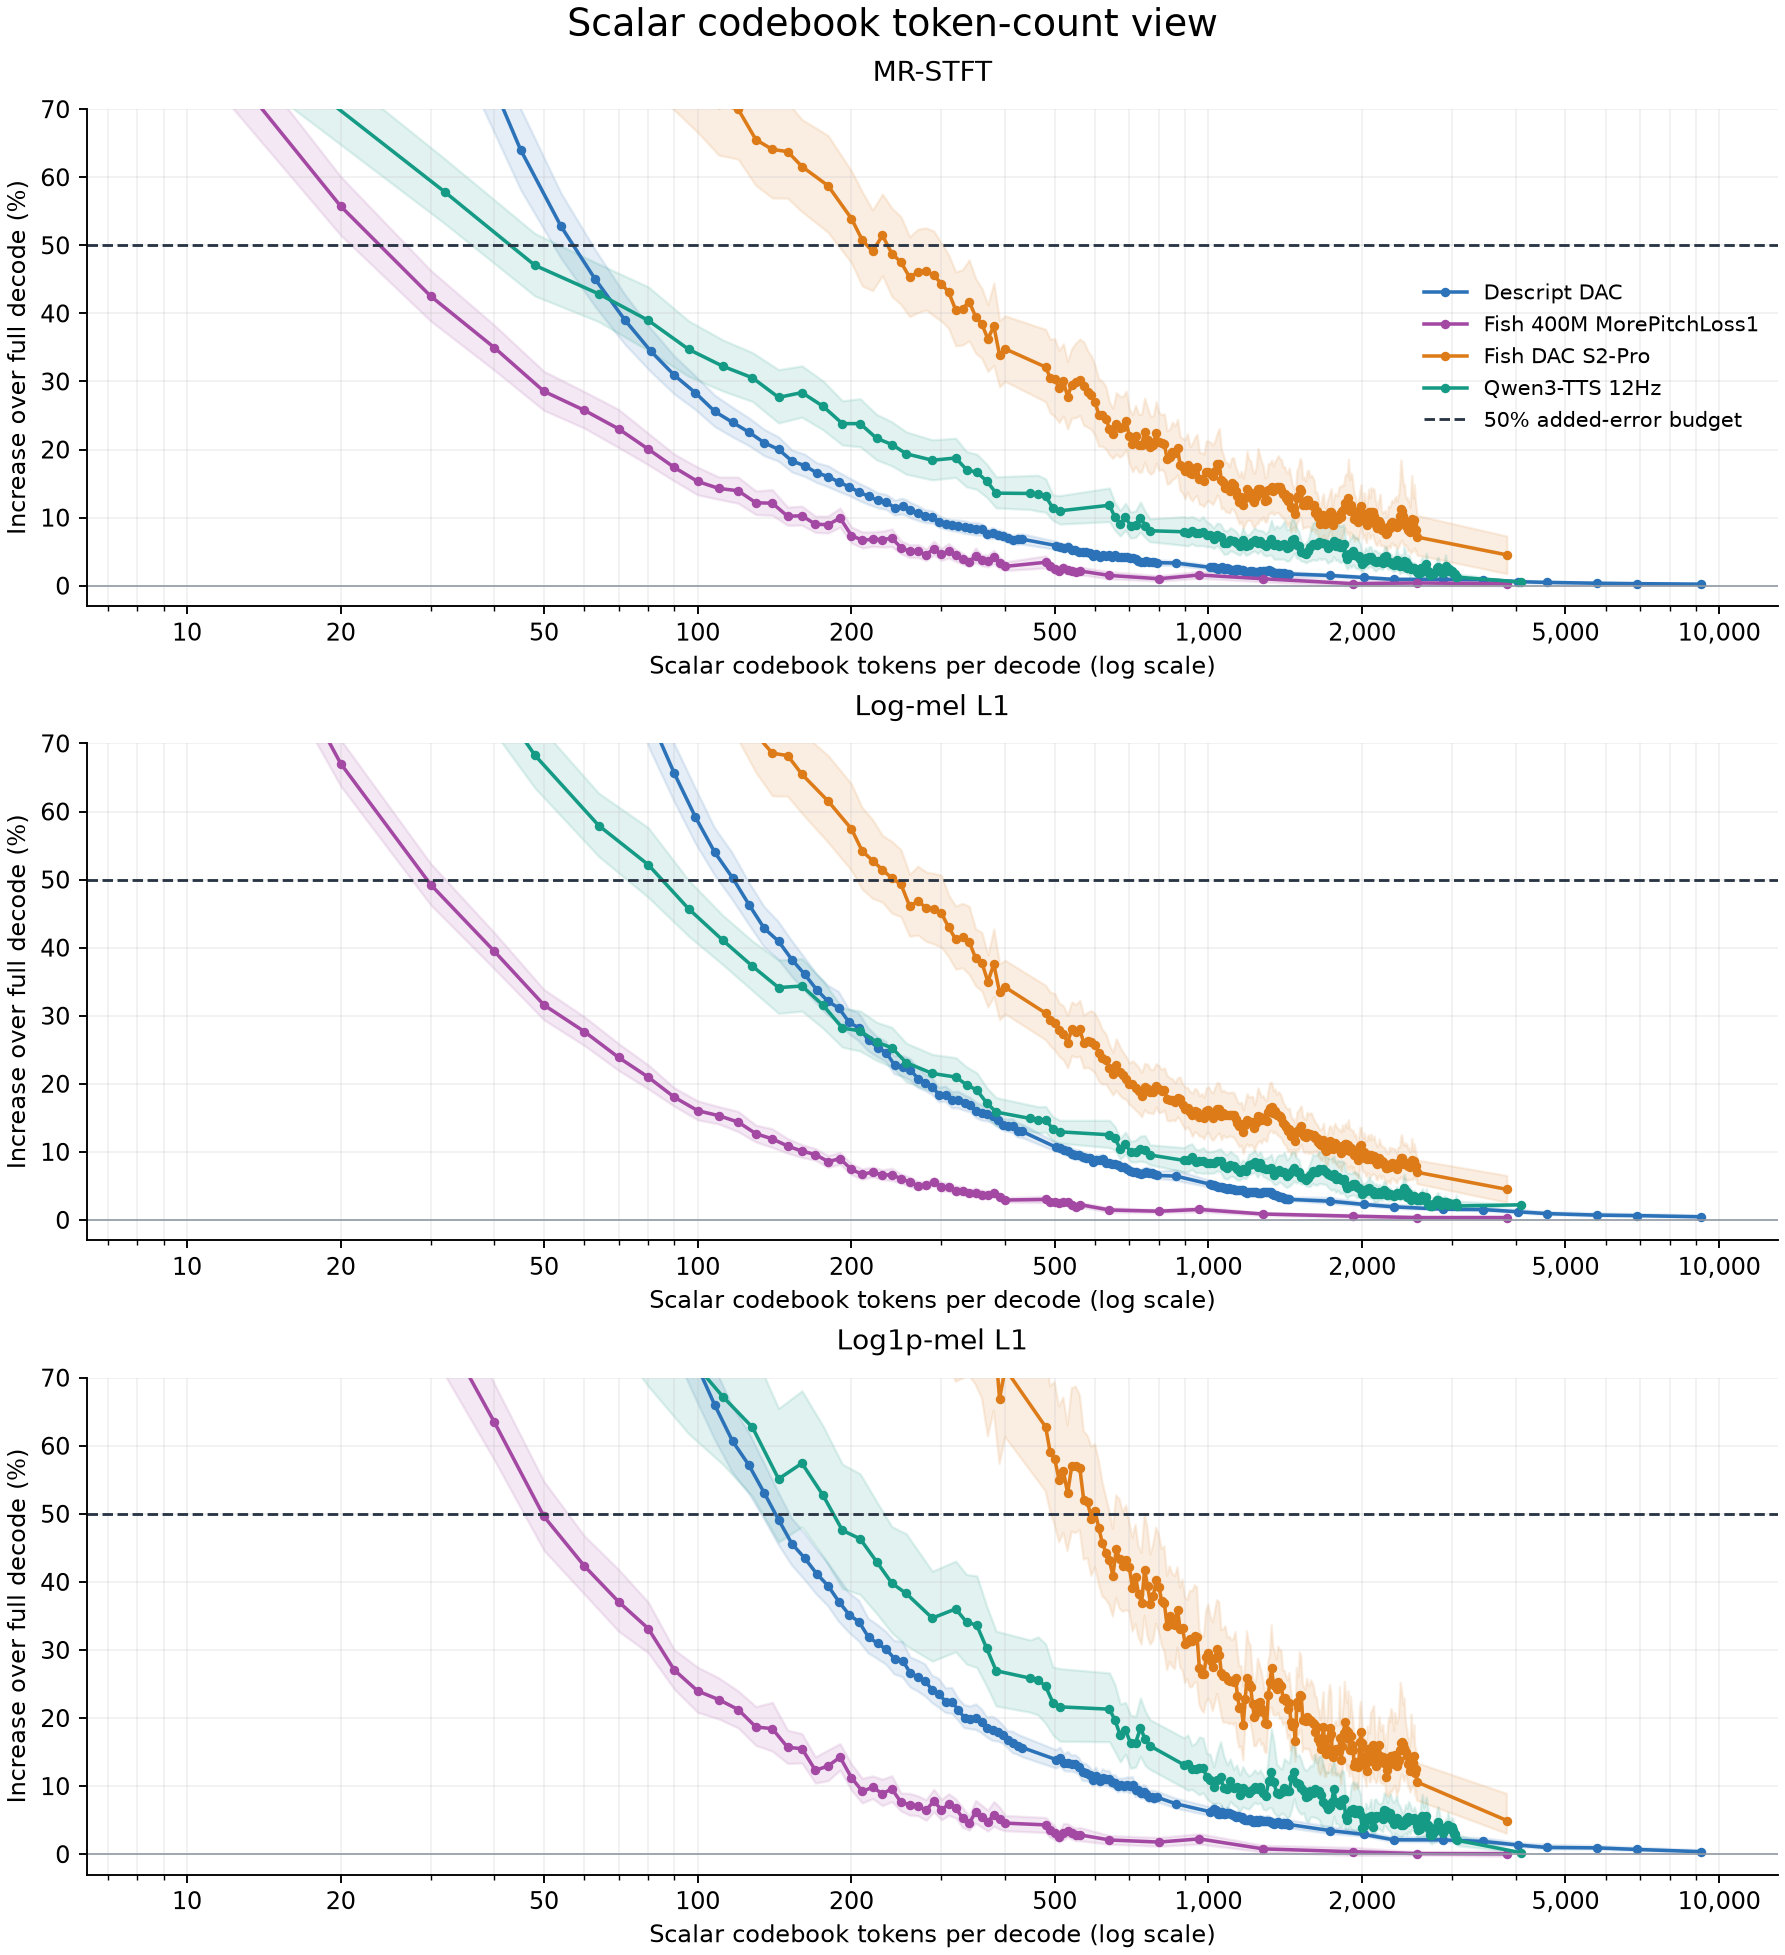 Scalar token count = temporal frames × retained codebooks. All books remain active; this is not an experiment dropping books. Each model therefore has a different minimum token bundle. Equal token counts do not imply equal duration or equal packed bit cost.
Absolute error by token count
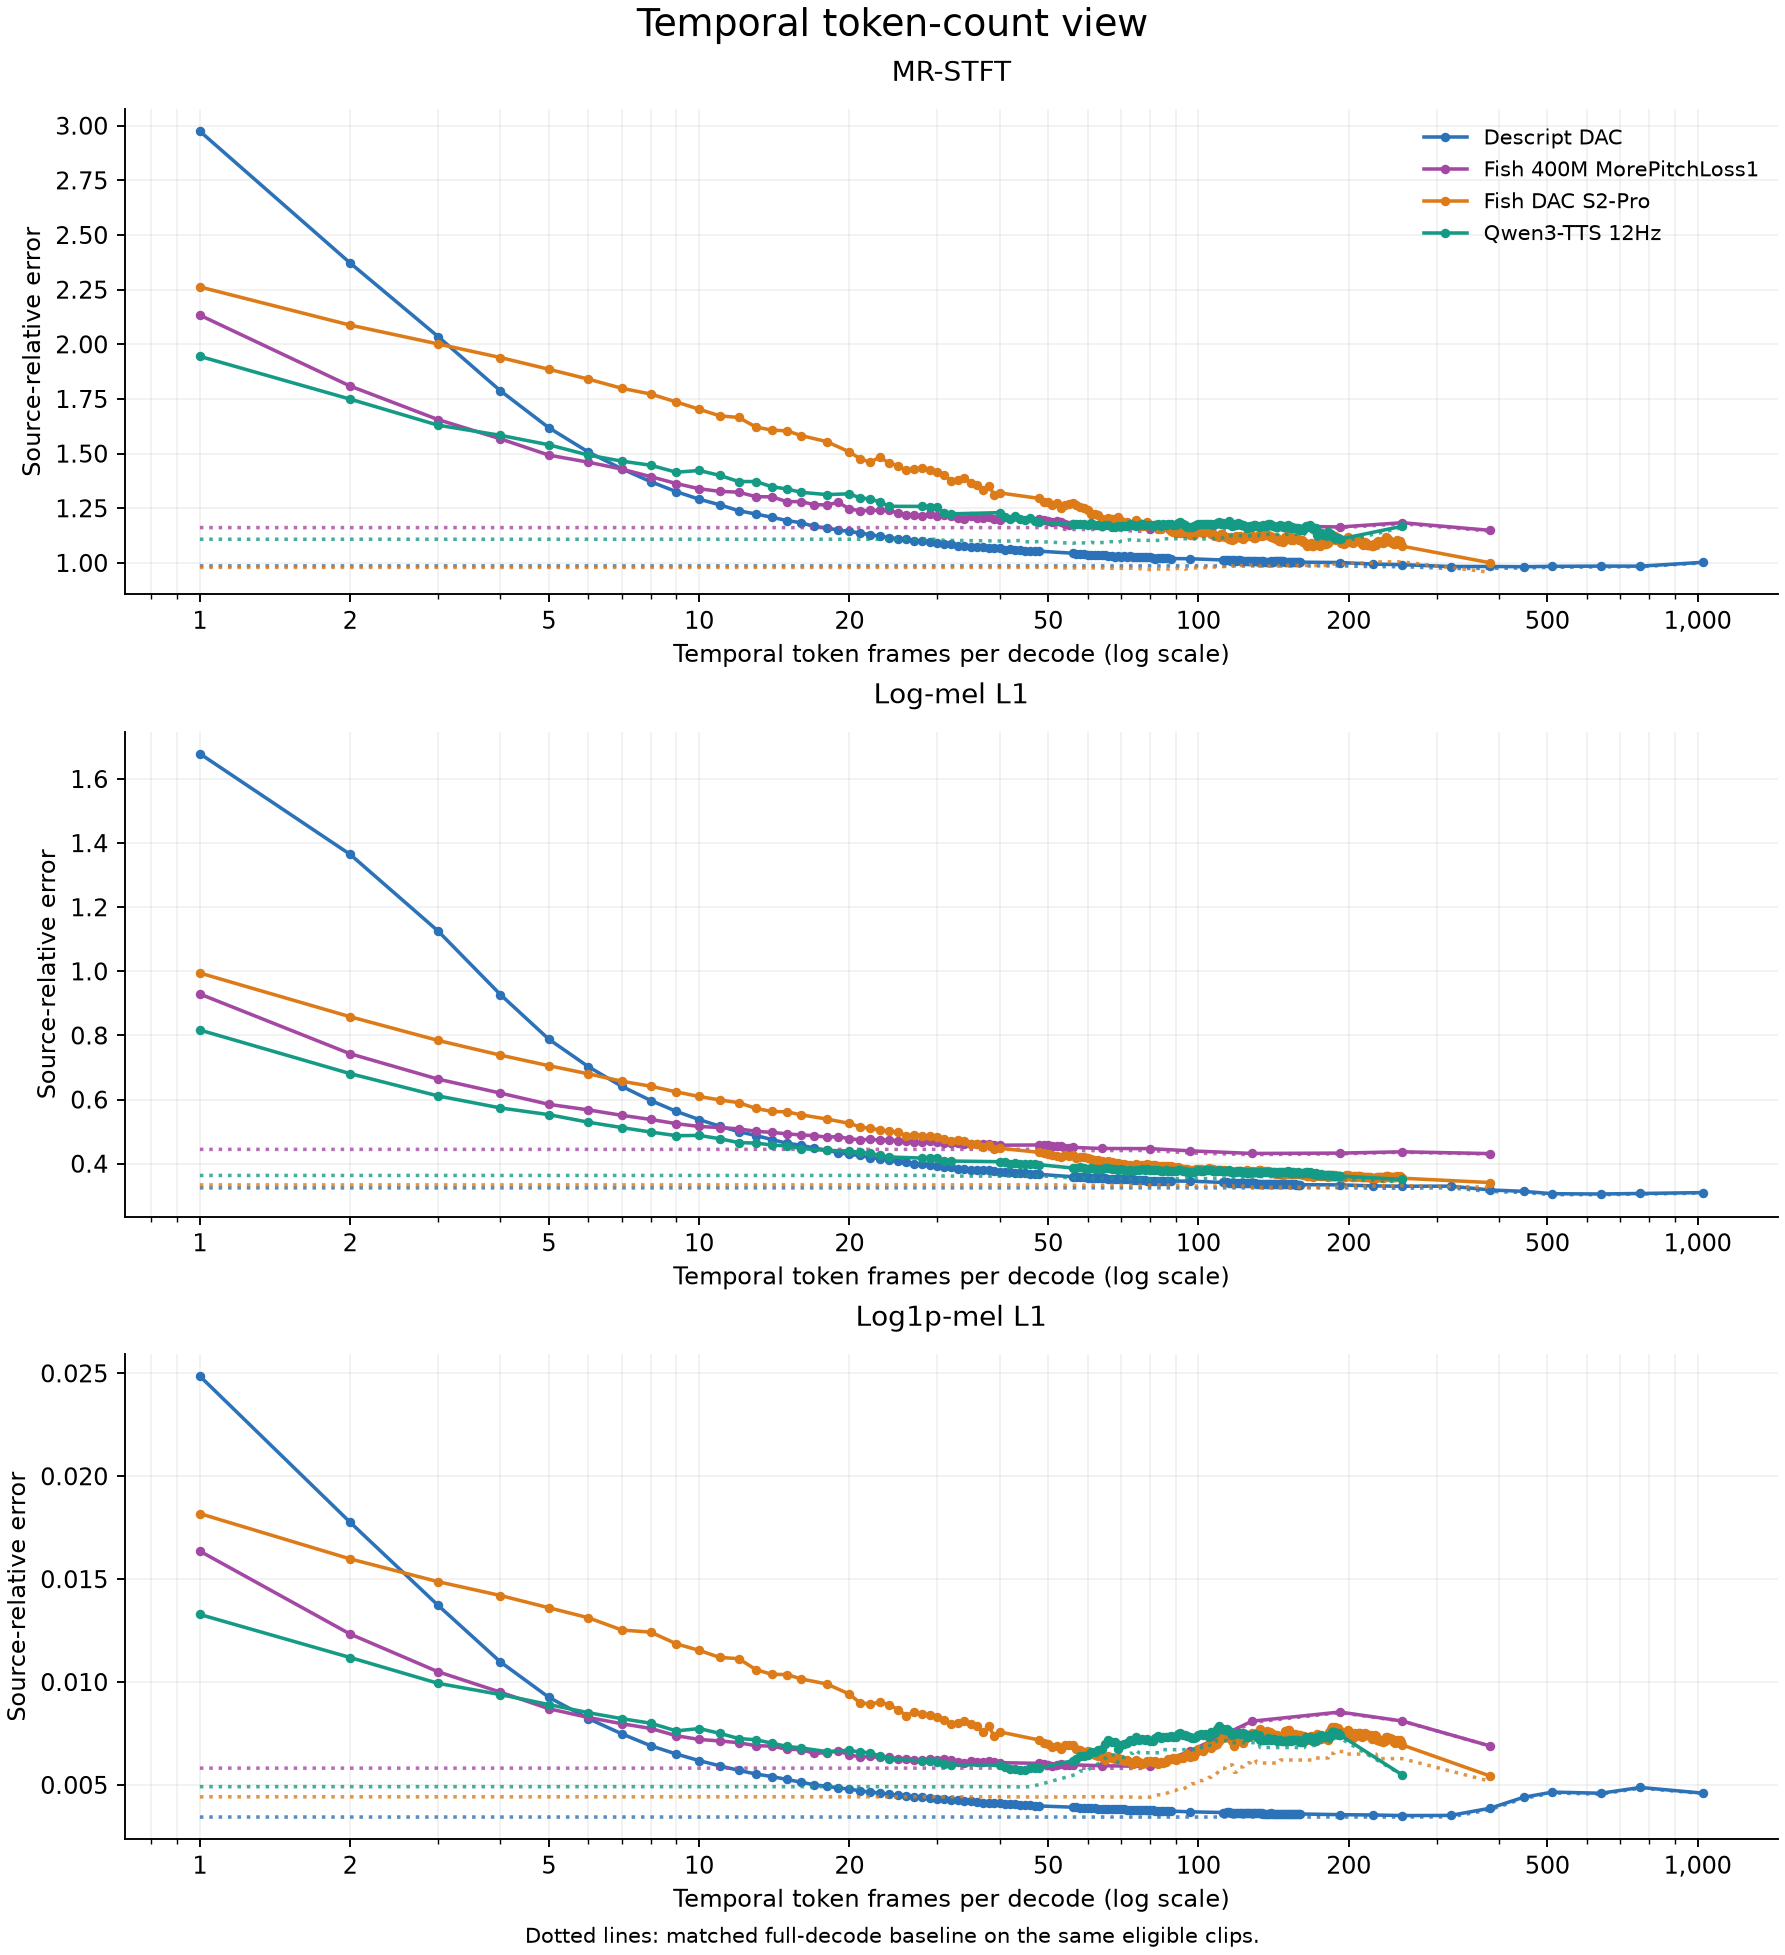 Source-relative error against temporal frames per call. Dotted lines use the matched full-decode control, retaining the same eligible clips as the solid treatment curve.
Dataset breakdown by token count
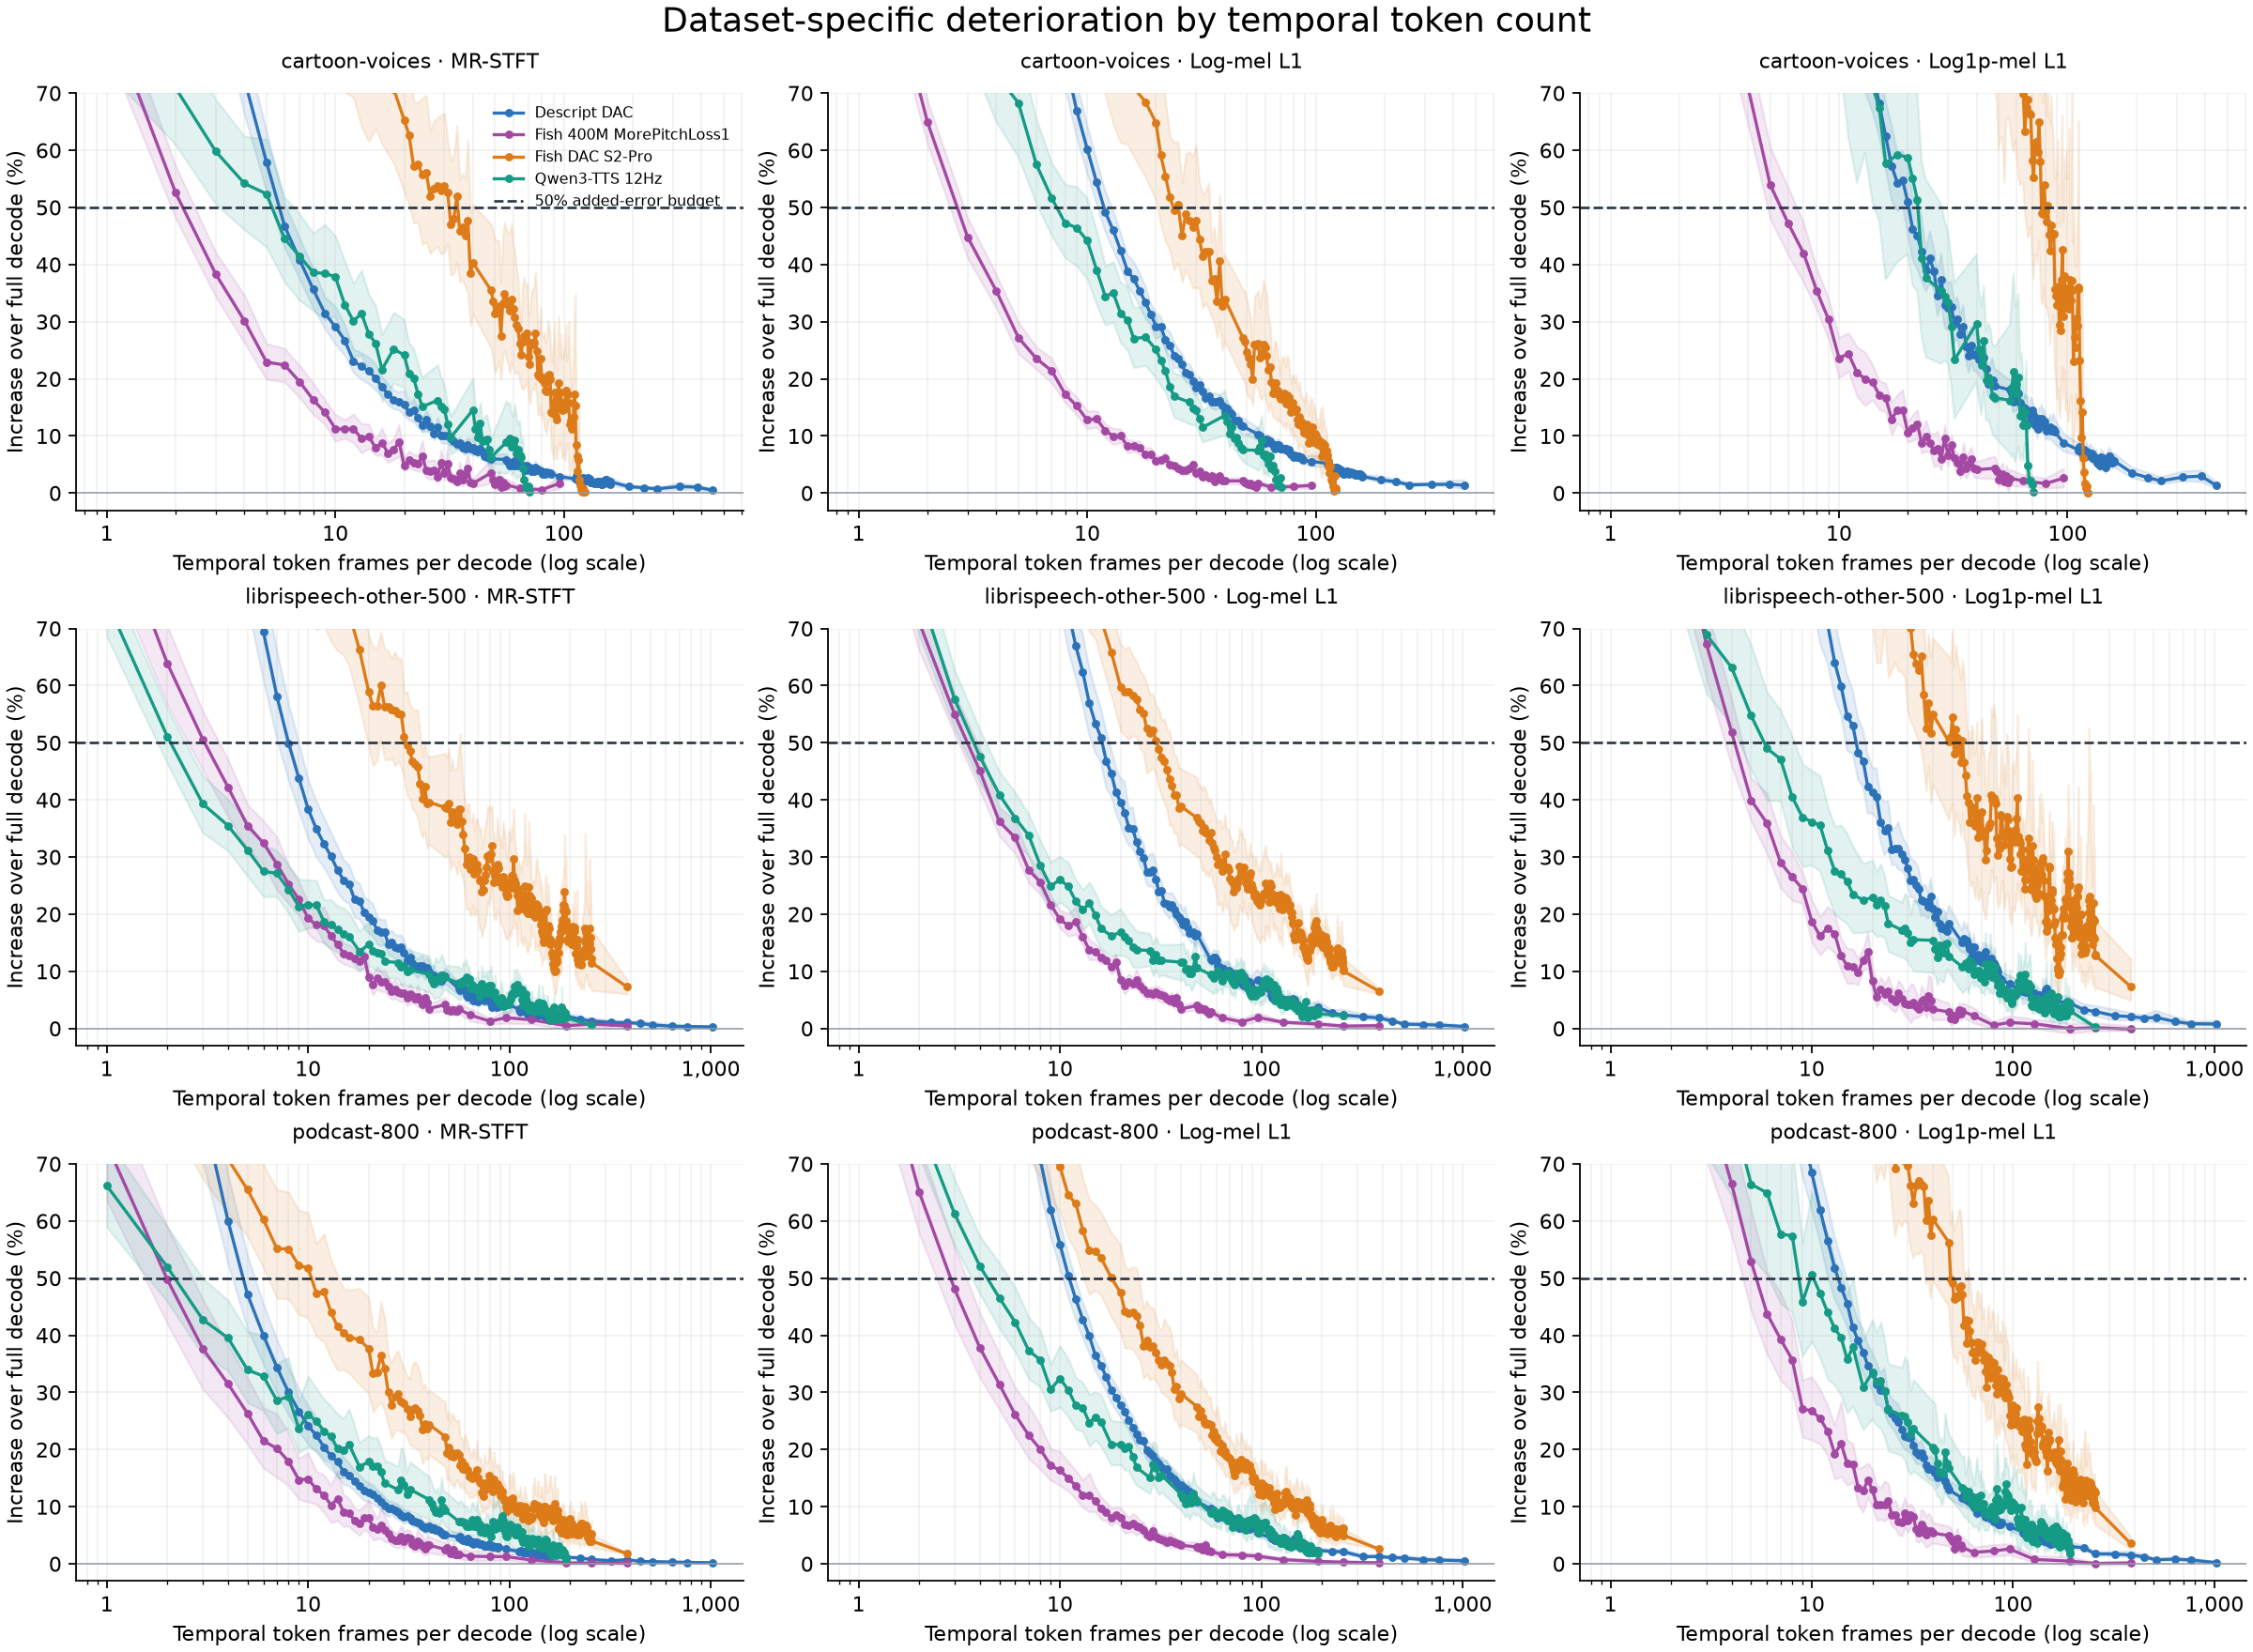 The same subgroup measurements and 95% paired bootstrap bands with temporal token frames on the x axis. The vertical range is focused on the 50% decision boundary.
Token-count distributions across clips
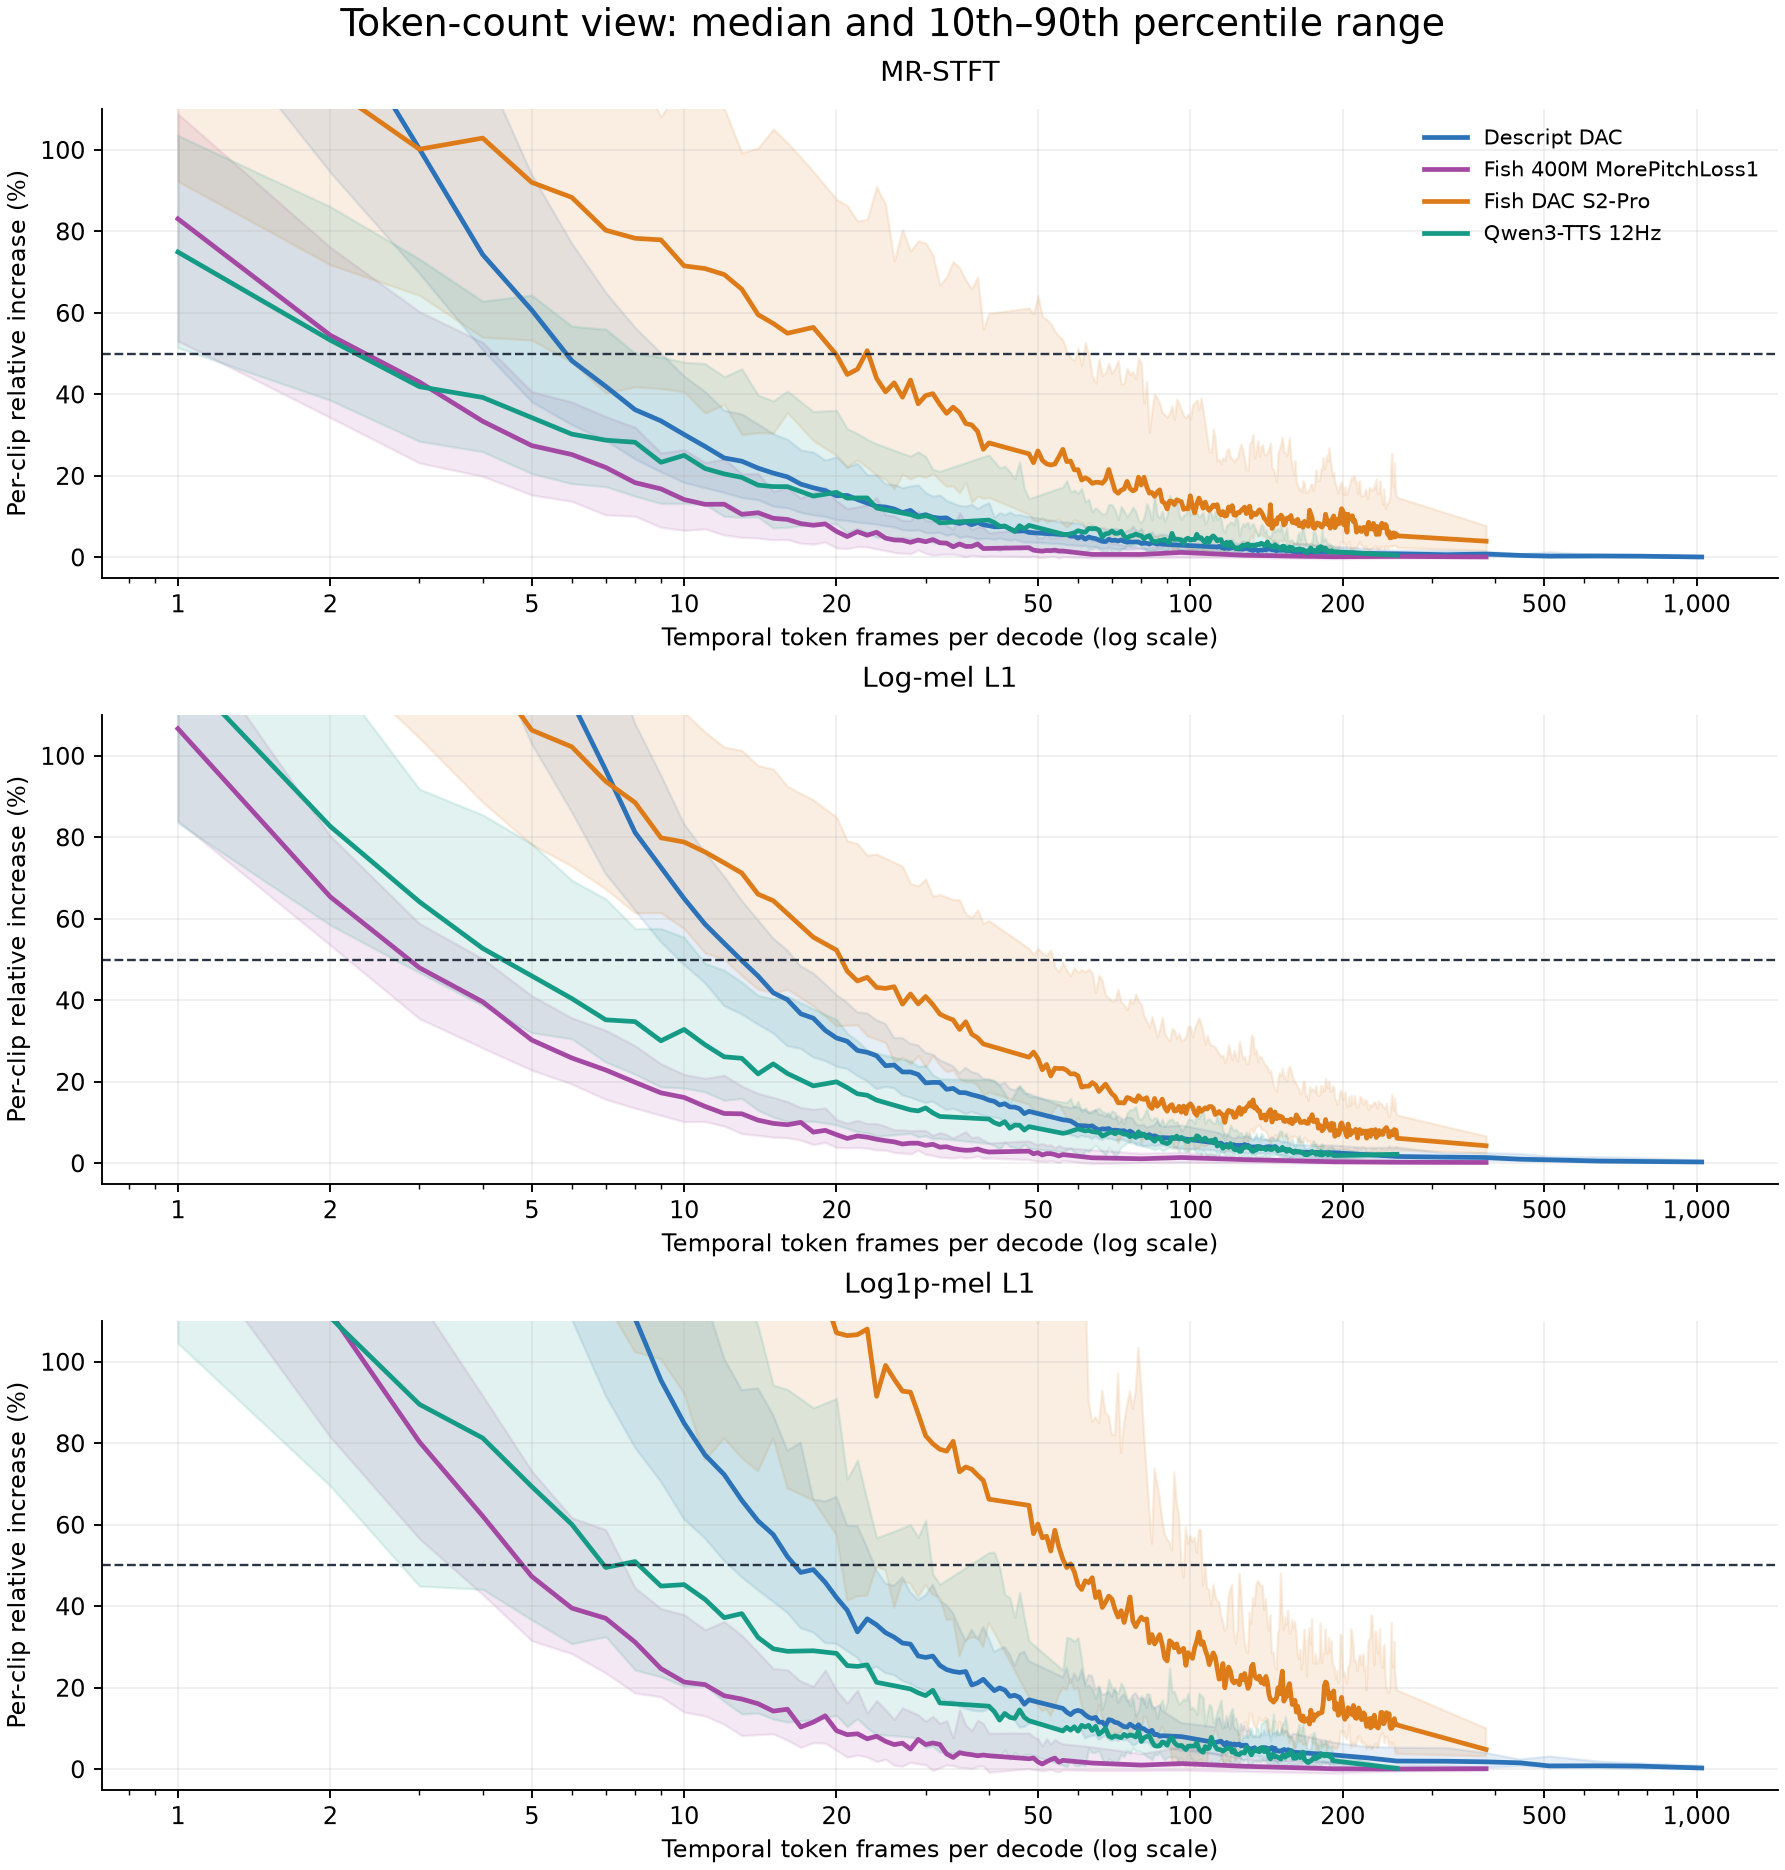 Median and 10th–90th percentile of individual clip increases against temporal token frames per call. Shading shows clip variation, not a confidence interval; the CSV retains values outside the displayed range.
Absolute reconstruction error
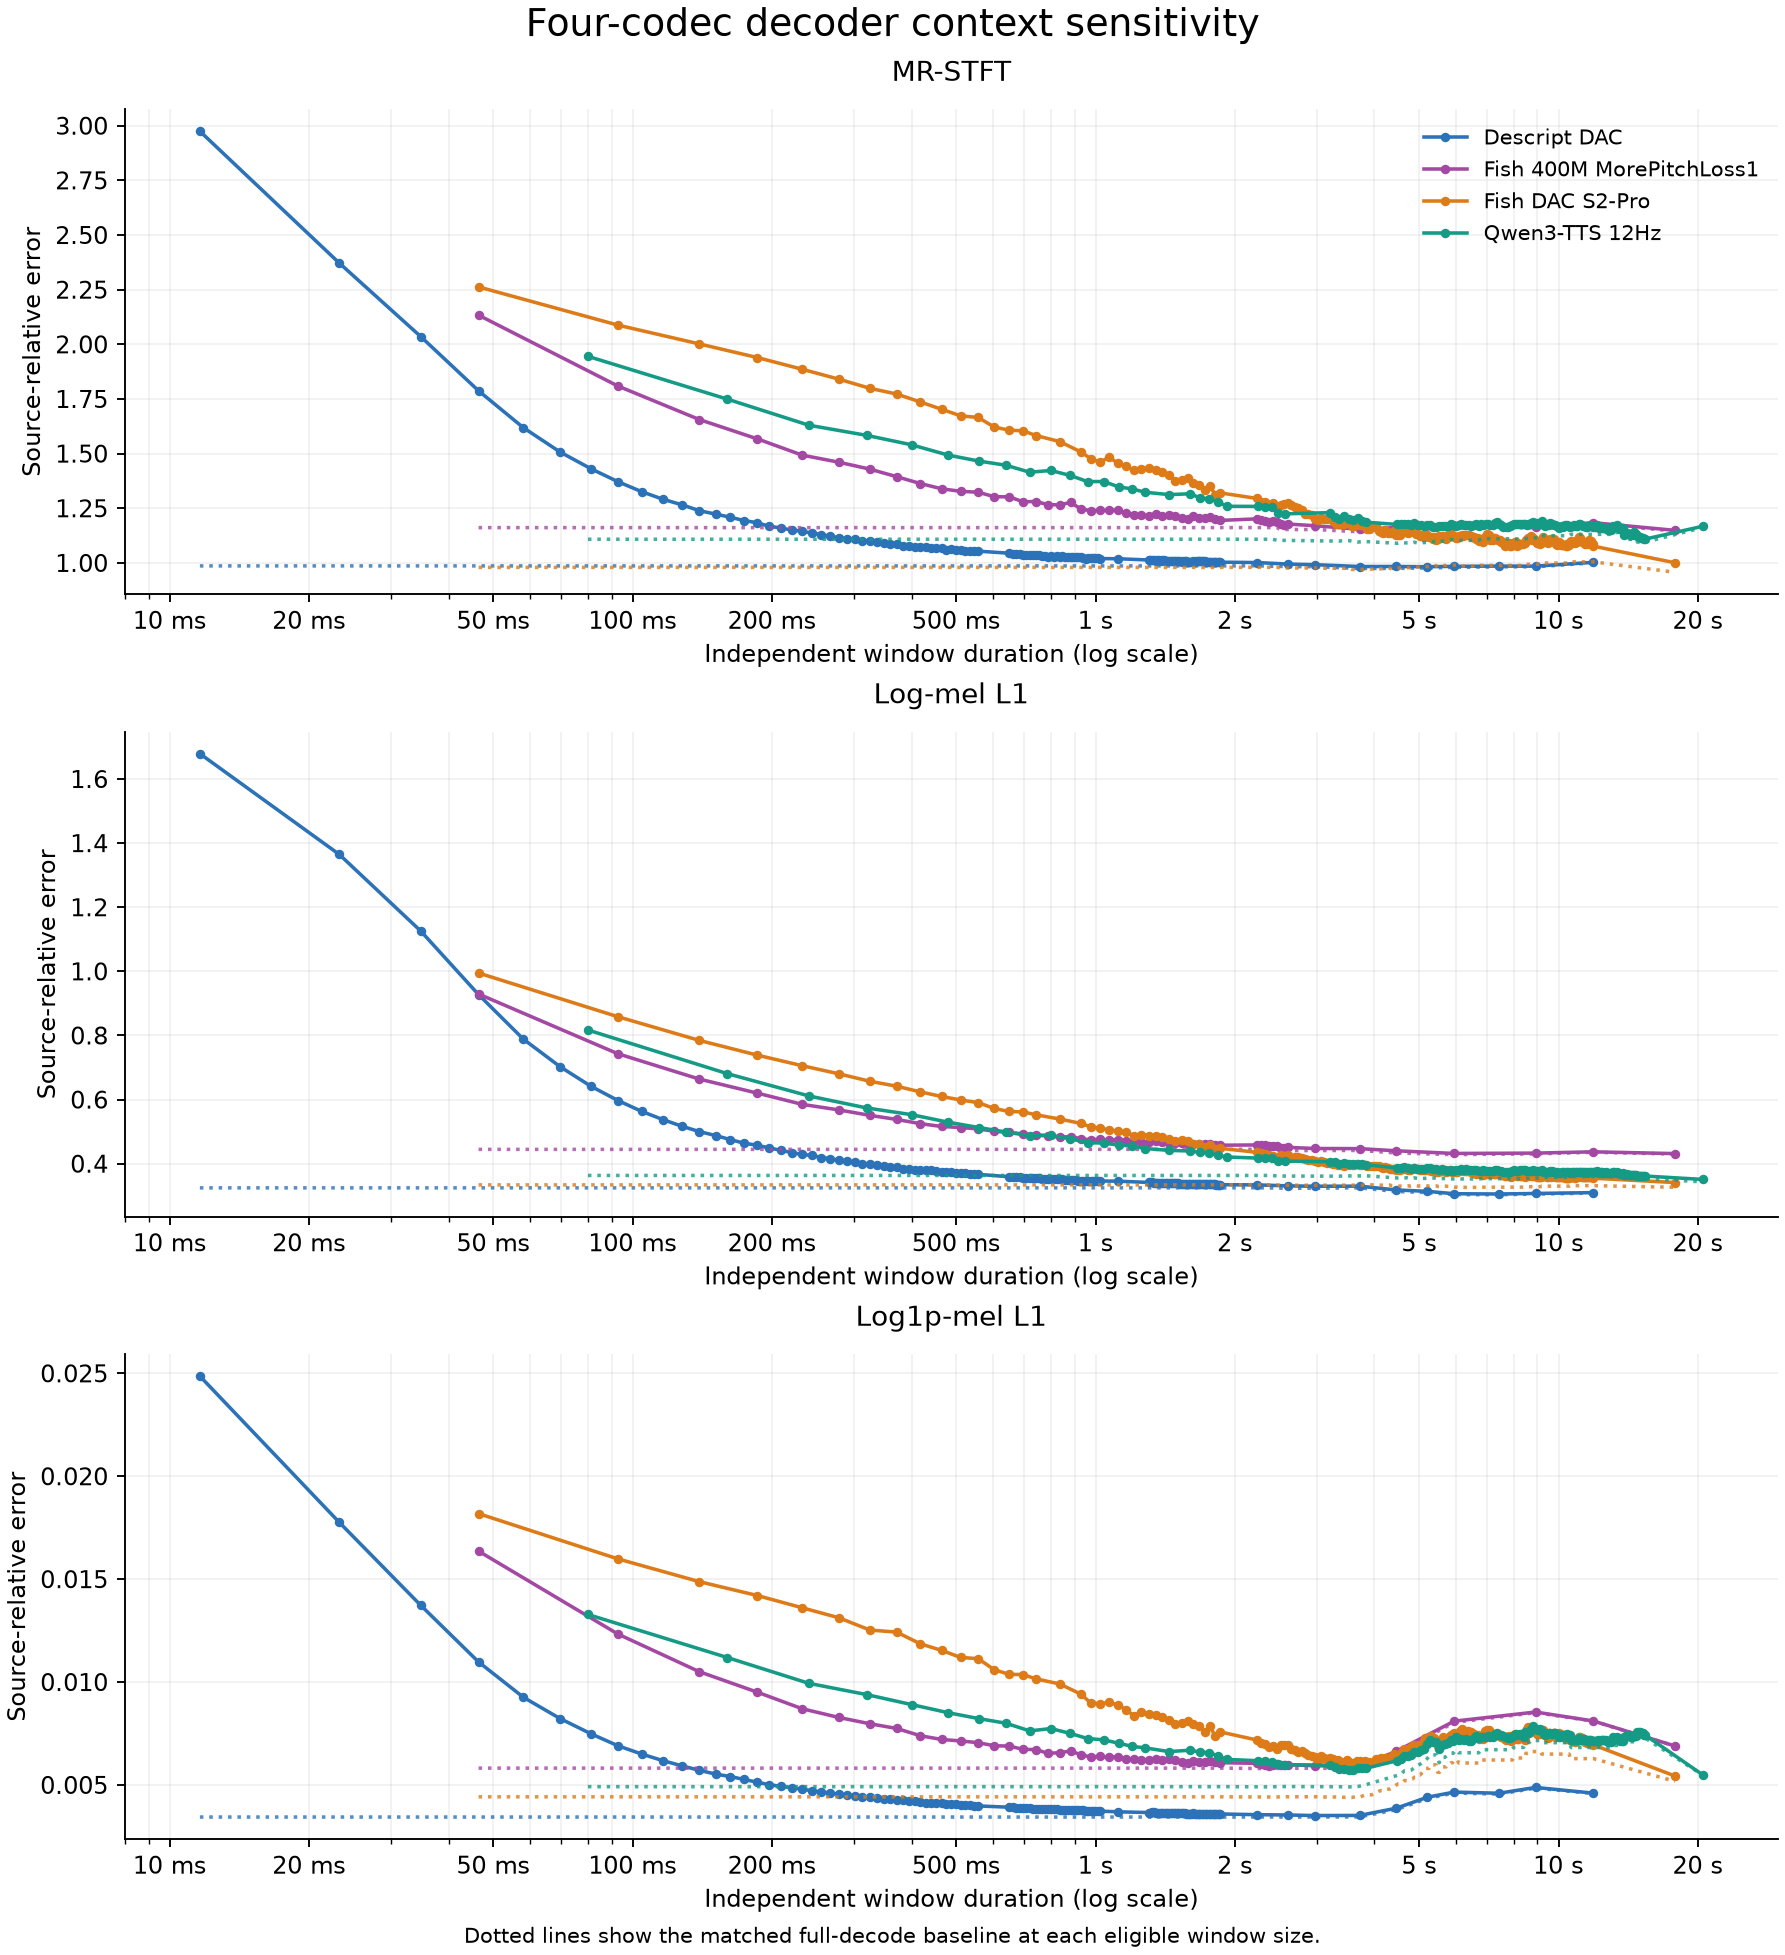 Solid lines: source-versus-windowed error. Dotted lines: source-versus-full error on the same eligible clips.
| Codec | Dataset | MR-STFT baseline | Log-mel baseline | Log1p-mel baseline |
|---|
| Descript DAC | overall | 0.98655 | 0.32474 | 0.003440 |
| Descript DAC | cartoon-voices | 0.95509 | 0.35848 | 0.002372 |
| Descript DAC | librispeech-other-500 | 1.06897 | 0.31378 | 0.002606 |
| Descript DAC | podcast-800 | 0.93558 | 0.30197 | 0.005343 |
| Fish 400M MorePitchLoss1 | overall | 1.16161 | 0.44479 | 0.005817 |
| Fish 400M MorePitchLoss1 | cartoon-voices | 1.11662 | 0.46159 | 0.003575 |
| Fish 400M MorePitchLoss1 | librispeech-other-500 | 1.25684 | 0.44764 | 0.004732 |
| Fish 400M MorePitchLoss1 | podcast-800 | 1.11136 | 0.42512 | 0.009144 |
| Fish DAC S2-Pro | overall | 0.97964 | 0.33396 | 0.004422 |
| Fish DAC S2-Pro | cartoon-voices | 0.93783 | 0.34000 | 0.002466 |
| Fish DAC S2-Pro | librispeech-other-500 | 1.02824 | 0.33182 | 0.003617 |
| Fish DAC S2-Pro | podcast-800 | 0.97284 | 0.33007 | 0.007185 |
| Qwen3-TTS 12Hz | overall | 1.10845 | 0.36342 | 0.004916 |
| Qwen3-TTS 12Hz | cartoon-voices | 1.08503 | 0.37735 | 0.003124 |
| Qwen3-TTS 12Hz | librispeech-other-500 | 1.19938 | 0.36738 | 0.003906 |
| Qwen3-TTS 12Hz | podcast-800 | 1.04095 | 0.34552 | 0.007719 |
Decoder divergence at fixed codes
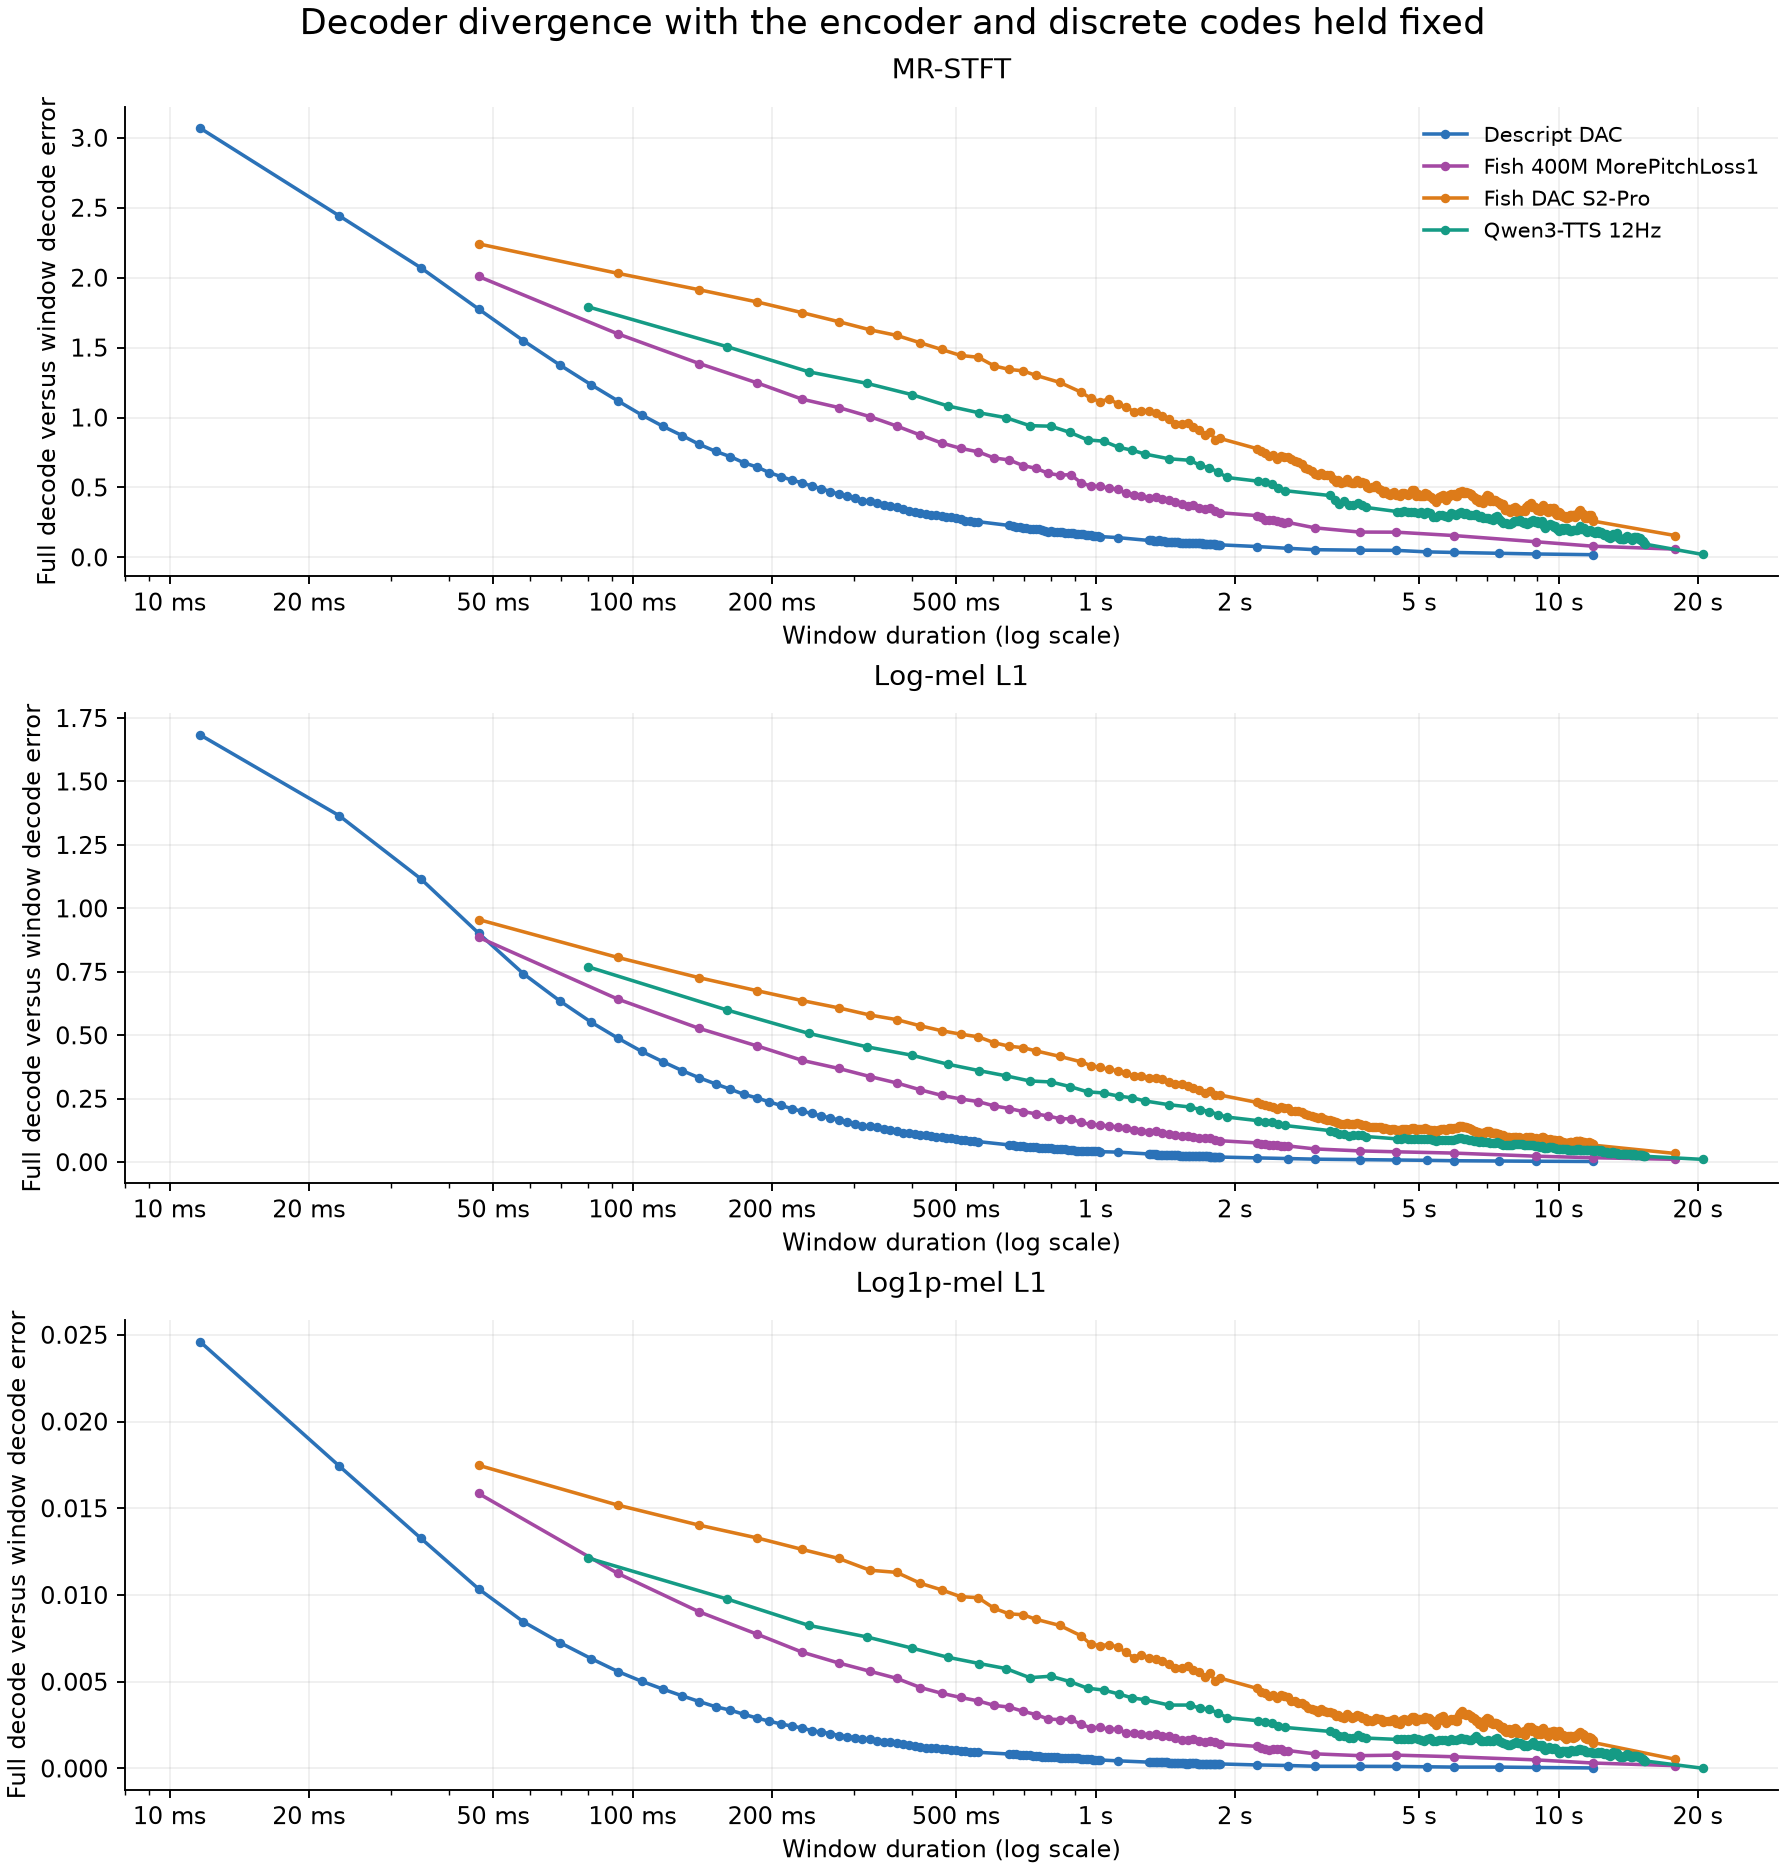 Full decoder output serves as the reference. These errors isolate the numerical effect of windowing; they are distinct from deterioration relative to the original source.
Source-relative error can decrease for an individual clip even while the windowed waveform differs from full decoding. Divergence from the control and increased error against the source answer different questions.
Error budgets from 5% through 50%
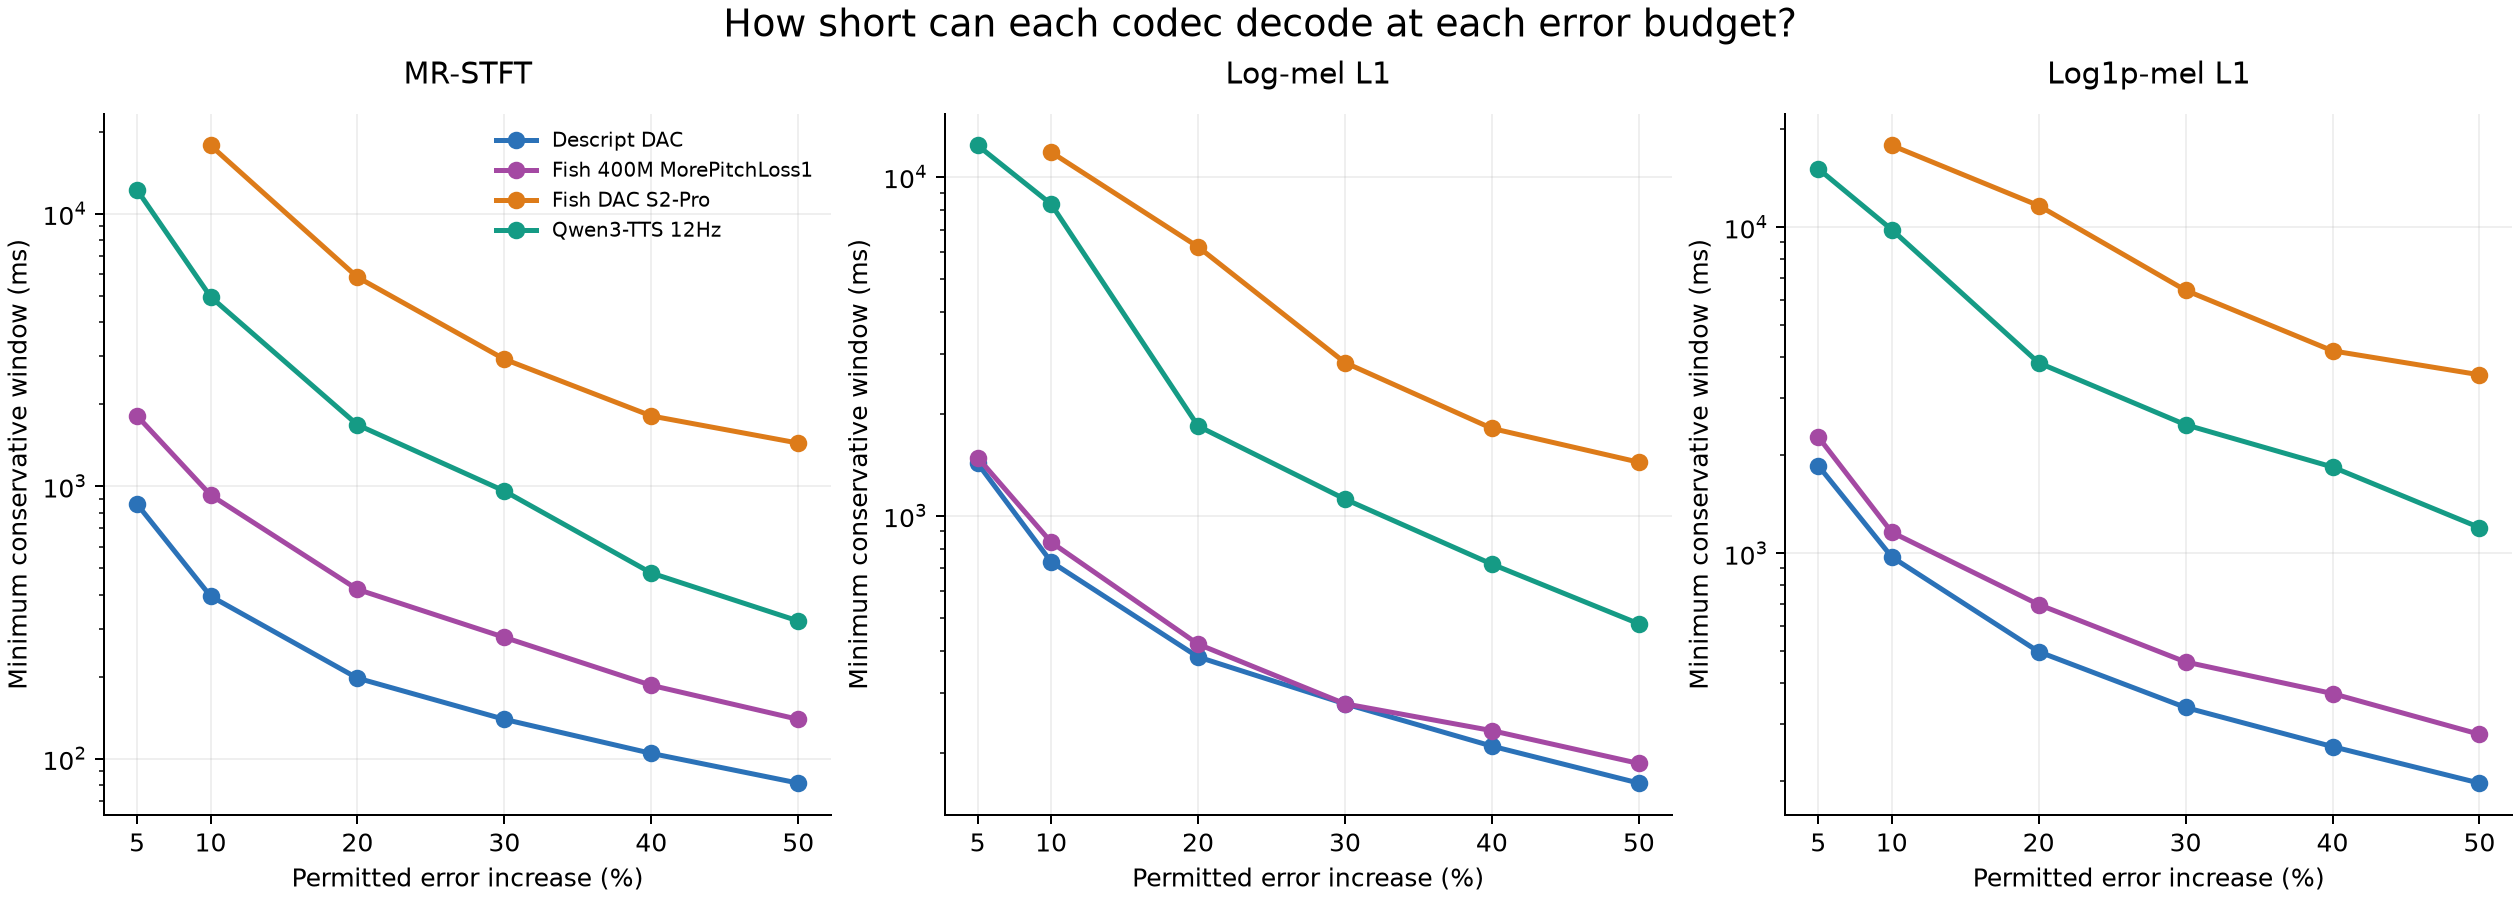 Minimum measured windows under the conservative upper-confidence-bound rule; duration normalizes differing token rates.
Descript DAC — threshold ranges
| Budget % | Metric | Mean-rule frames | CI-rule frames | CI-rule ms | Measured fail/pass bracket | Pass CI % | Clips |
|---|
| 5 | MR-STFT | 62 | 74 | 859.1 | (73, 74] frames | [3.7, 4.6] | 60 |
| 5 | Log-mel L1 | 115 | 123 | 1428.0 | (122, 123] frames | [4.1, 5.0] | 60 |
| 5 | Log1p-mel L1 | 141 | 160 | 1857.6 | (159, 160] frames | [3.8, 5.0] | 60 |
| 10 | MR-STFT | 33 | 34 | 394.7 | (33, 34] frames | [8.3, 9.9] | 60 |
| 10 | Log-mel L1 | 60 | 63 | 731.4 | (62, 63] frames | [8.6, 10.0] | 60 |
| 10 | Log1p-mel L1 | 80 | 84 | 975.2 | (83, 84] frames | [7.9, 10.0] | 60 |
| 20 | MR-STFT | 17 | 17 | 197.4 | (16, 17] frames | [16.7, 19.9] | 60 |
| 20 | Log-mel L1 | 32 | 33 | 383.1 | (32, 33] frames | [17.3, 19.4] | 60 |
| 20 | Log1p-mel L1 | 40 | 43 | 499.2 | (42, 43] frames | [16.6, 19.7] | 60 |
| 30 | MR-STFT | 11 | 12 | 139.3 | (11, 12] frames | [23.4, 28.0] | 60 |
| 30 | Log-mel L1 | 22 | 24 | 278.6 | (23, 24] frames | [24.8, 28.2] | 60 |
| 30 | Log1p-mel L1 | 27 | 29 | 336.7 | (28, 29] frames | [24.5, 28.9] | 60 |
| 40 | MR-STFT | 8 | 9 | 104.5 | (8, 9] frames | [31.4, 37.7] | 60 |
| 40 | Log-mel L1 | 17 | 18 | 209.0 | (17, 18] frames | [33.7, 38.5] | 60 |
| 40 | Log1p-mel L1 | 20 | 22 | 255.4 | (21, 22] frames | [32.5, 38.4] | 60 |
| 50 | MR-STFT | 7 | 7 | 81.3 | (6, 7] frames | [41.0, 49.3] | 60 |
| 50 | Log-mel L1 | 14 | 14 | 162.5 | (13, 14] frames | [43.4, 49.6] | 60 |
| 50 | Log1p-mel L1 | 16 | 17 | 197.4 | (16, 17] frames | [42.4, 49.3] | 60 |
Fish 400M MorePitchLoss1 — threshold ranges
| Budget % | Metric | Mean-rule frames | CI-rule frames | CI-rule ms | Measured fail/pass bracket | Pass CI % | Clips |
|---|
| 5 | MR-STFT | 32 | 39 | 1811.2 | (38, 39] frames | [2.5, 4.2] | 60 |
| 5 | Log-mel L1 | 30 | 32 | 1486.1 | (31, 32] frames | [3.6, 5.0] | 60 |
| 5 | Log1p-mel L1 | 40 | 49 | 2275.6 | (48, 49] frames | [2.5, 4.8] | 59 |
| 10 | MR-STFT | 17 | 20 | 928.8 | (19, 20] frames | [6.3, 8.6] | 60 |
| 10 | Log-mel L1 | 17 | 18 | 835.9 | (17, 18] frames | [7.7, 9.5] | 60 |
| 10 | Log1p-mel L1 | 21 | 25 | 1161.0 | (24, 25] frames | [6.3, 9.0] | 60 |
| 20 | MR-STFT | 9 | 9 | 418.0 | (8, 9] frames | [15.4, 19.3] | 60 |
| 20 | Log-mel L1 | 9 | 9 | 418.0 | (8, 9] frames | [16.7, 19.4] | 60 |
| 20 | Log1p-mel L1 | 13 | 15 | 696.6 | (14, 15] frames | [13.3, 18.2] | 60 |
| 30 | MR-STFT | 5 | 6 | 278.6 | (5, 6] frames | [23.1, 28.5] | 60 |
| 30 | Log-mel L1 | 6 | 6 | 278.6 | (5, 6] frames | [25.6, 29.9] | 60 |
| 30 | Log1p-mel L1 | 9 | 10 | 464.4 | (9, 10] frames | [20.8, 27.5] | 60 |
| 40 | MR-STFT | 4 | 4 | 185.8 | (3, 4] frames | [31.6, 38.3] | 60 |
| 40 | Log-mel L1 | 4 | 5 | 232.2 | (4, 5] frames | [29.4, 33.9] | 60 |
| 40 | Log1p-mel L1 | 7 | 8 | 371.5 | (7, 8] frames | [29.6, 37.0] | 60 |
| 50 | MR-STFT | 3 | 3 | 139.3 | (2, 3] frames | [38.9, 46.3] | 60 |
| 50 | Log-mel L1 | 3 | 4 | 185.8 | (3, 4] frames | [36.9, 42.2] | 60 |
| 50 | Log1p-mel L1 | 5 | 6 | 278.6 | (5, 6] frames | [38.2, 46.8] | 60 |
Fish DAC S2-Pro — threshold ranges
| Budget % | Metric | Mean-rule frames | CI-rule frames | CI-rule ms | Measured fail/pass bracket | Pass CI % | Clips |
|---|
| 5 | MR-STFT | 384 | — | — | not established in tested sweep | [—, —] | — |
| 5 | Log-mel L1 | 384 | — | — | not established in tested sweep | [—, —] | — |
| 5 | Log1p-mel L1 | 384 | — | — | not established in tested sweep | [—, —] | — |
| 10 | MR-STFT | 241 | 384 | 17832.9 | (256, 384] frames | [1.8, 7.3] | 4 |
| 10 | Log-mel L1 | 200 | 255 | 11842.2 | (254, 255] frames | [6.2, 9.8] | 15 |
| 10 | Log1p-mel L1 | 384 | 384 | 17832.9 | (256, 384] frames | [3.0, 8.9] | 4 |
| 20 | MR-STFT | 88 | 126 | 5851.4 | (125, 126] frames | [9.8, 19.2] | 23 |
| 20 | Log-mel L1 | 70 | 134 | 6222.9 | (133, 134] frames | [12.7, 18.9] | 21 |
| 20 | Log1p-mel L1 | 157 | 251 | 11656.4 | (250, 251] frames | [9.9, 18.3] | 15 |
| 30 | MR-STFT | 57 | 63 | 2925.7 | (62, 63] frames | [20.1, 29.2] | 58 |
| 30 | Log-mel L1 | 49 | 61 | 2832.8 | (60, 61] frames | [20.4, 29.2] | 58 |
| 30 | Log1p-mel L1 | 105 | 138 | 6408.7 | (137, 138] frames | [19.9, 30.0] | 21 |
| 40 | MR-STFT | 35 | 39 | 1811.2 | (38, 39] frames | [29.2, 38.9] | 60 |
| 40 | Log-mel L1 | 35 | 39 | 1811.2 | (38, 39] frames | [29.4, 37.7] | 60 |
| 40 | Log1p-mel L1 | 80 | 90 | 4179.6 | (89, 90] frames | [25.2, 37.8] | 45 |
| 50 | MR-STFT | 24 | 31 | 1439.6 | (30, 31] frames | [37.8, 48.6] | 60 |
| 50 | Log-mel L1 | 25 | 31 | 1439.6 | (30, 31] frames | [38.7, 47.7] | 60 |
| 50 | Log1p-mel L1 | 61 | 76 | 3529.4 | (75, 76] frames | [32.0, 47.9] | 55 |
Qwen3-TTS 12Hz — threshold ranges
| Budget % | Metric | Mean-rule frames | CI-rule frames | CI-rule ms | Measured fail/pass bracket | Pass CI % | Clips |
|---|
| 5 | MR-STFT | 121 | 153 | 12240.0 | (152, 153] frames | [1.7, 3.6] | 15 |
| 5 | Log-mel L1 | 122 | 155 | 12400.0 | (154, 155] frames | [2.5, 4.9] | 15 |
| 5 | Log1p-mel L1 | 168 | 189 | 15120.0 | (188, 189] frames | [2.0, 4.0] | 12 |
| 10 | MR-STFT | 44 | 62 | 4960.0 | (61, 62] frames | [5.7, 9.4] | 32 |
| 10 | Log-mel L1 | 48 | 104 | 8320.0 | (103, 104] frames | [5.3, 10.0] | 19 |
| 10 | Log1p-mel L1 | 95 | 123 | 9840.0 | (122, 123] frames | [3.6, 9.6] | 16 |
| 20 | MR-STFT | 16 | 21 | 1680.0 | (20, 21] frames | [14.5, 19.7] | 60 |
| 20 | Log-mel L1 | 21 | 23 | 1840.0 | (22, 23] frames | [15.0, 19.4] | 60 |
| 20 | Log1p-mel L1 | 41 | 48 | 3840.0 | (47, 48] frames | [12.5, 19.8] | 50 |
| 30 | MR-STFT | 9 | 12 | 960.0 | (11, 12] frames | [20.7, 27.2] | 60 |
| 30 | Log-mel L1 | 12 | 14 | 1120.0 | (13, 14] frames | [23.4, 29.0] | 60 |
| 30 | Log1p-mel L1 | 24 | 31 | 2480.0 | (30, 31] frames | [17.5, 27.5] | 58 |
| 40 | MR-STFT | 5 | 6 | 480.0 | (5, 6] frames | [30.7, 38.9] | 60 |
| 40 | Log-mel L1 | 8 | 9 | 720.0 | (8, 9] frames | [30.3, 38.2] | 60 |
| 40 | Log1p-mel L1 | 15 | 23 | 1840.0 | (22, 23] frames | [24.6, 36.5] | 60 |
| 50 | MR-STFT | 3 | 4 | 320.0 | (3, 4] frames | [38.8, 47.3] | 60 |
| 50 | Log-mel L1 | 6 | 6 | 480.0 | (5, 6] frames | [41.7, 49.9] | 60 |
| 50 | Log1p-mel L1 | 12 | 15 | 1200.0 | (14, 15] frames | [32.5, 48.1] | 60 |
Differences between datasets
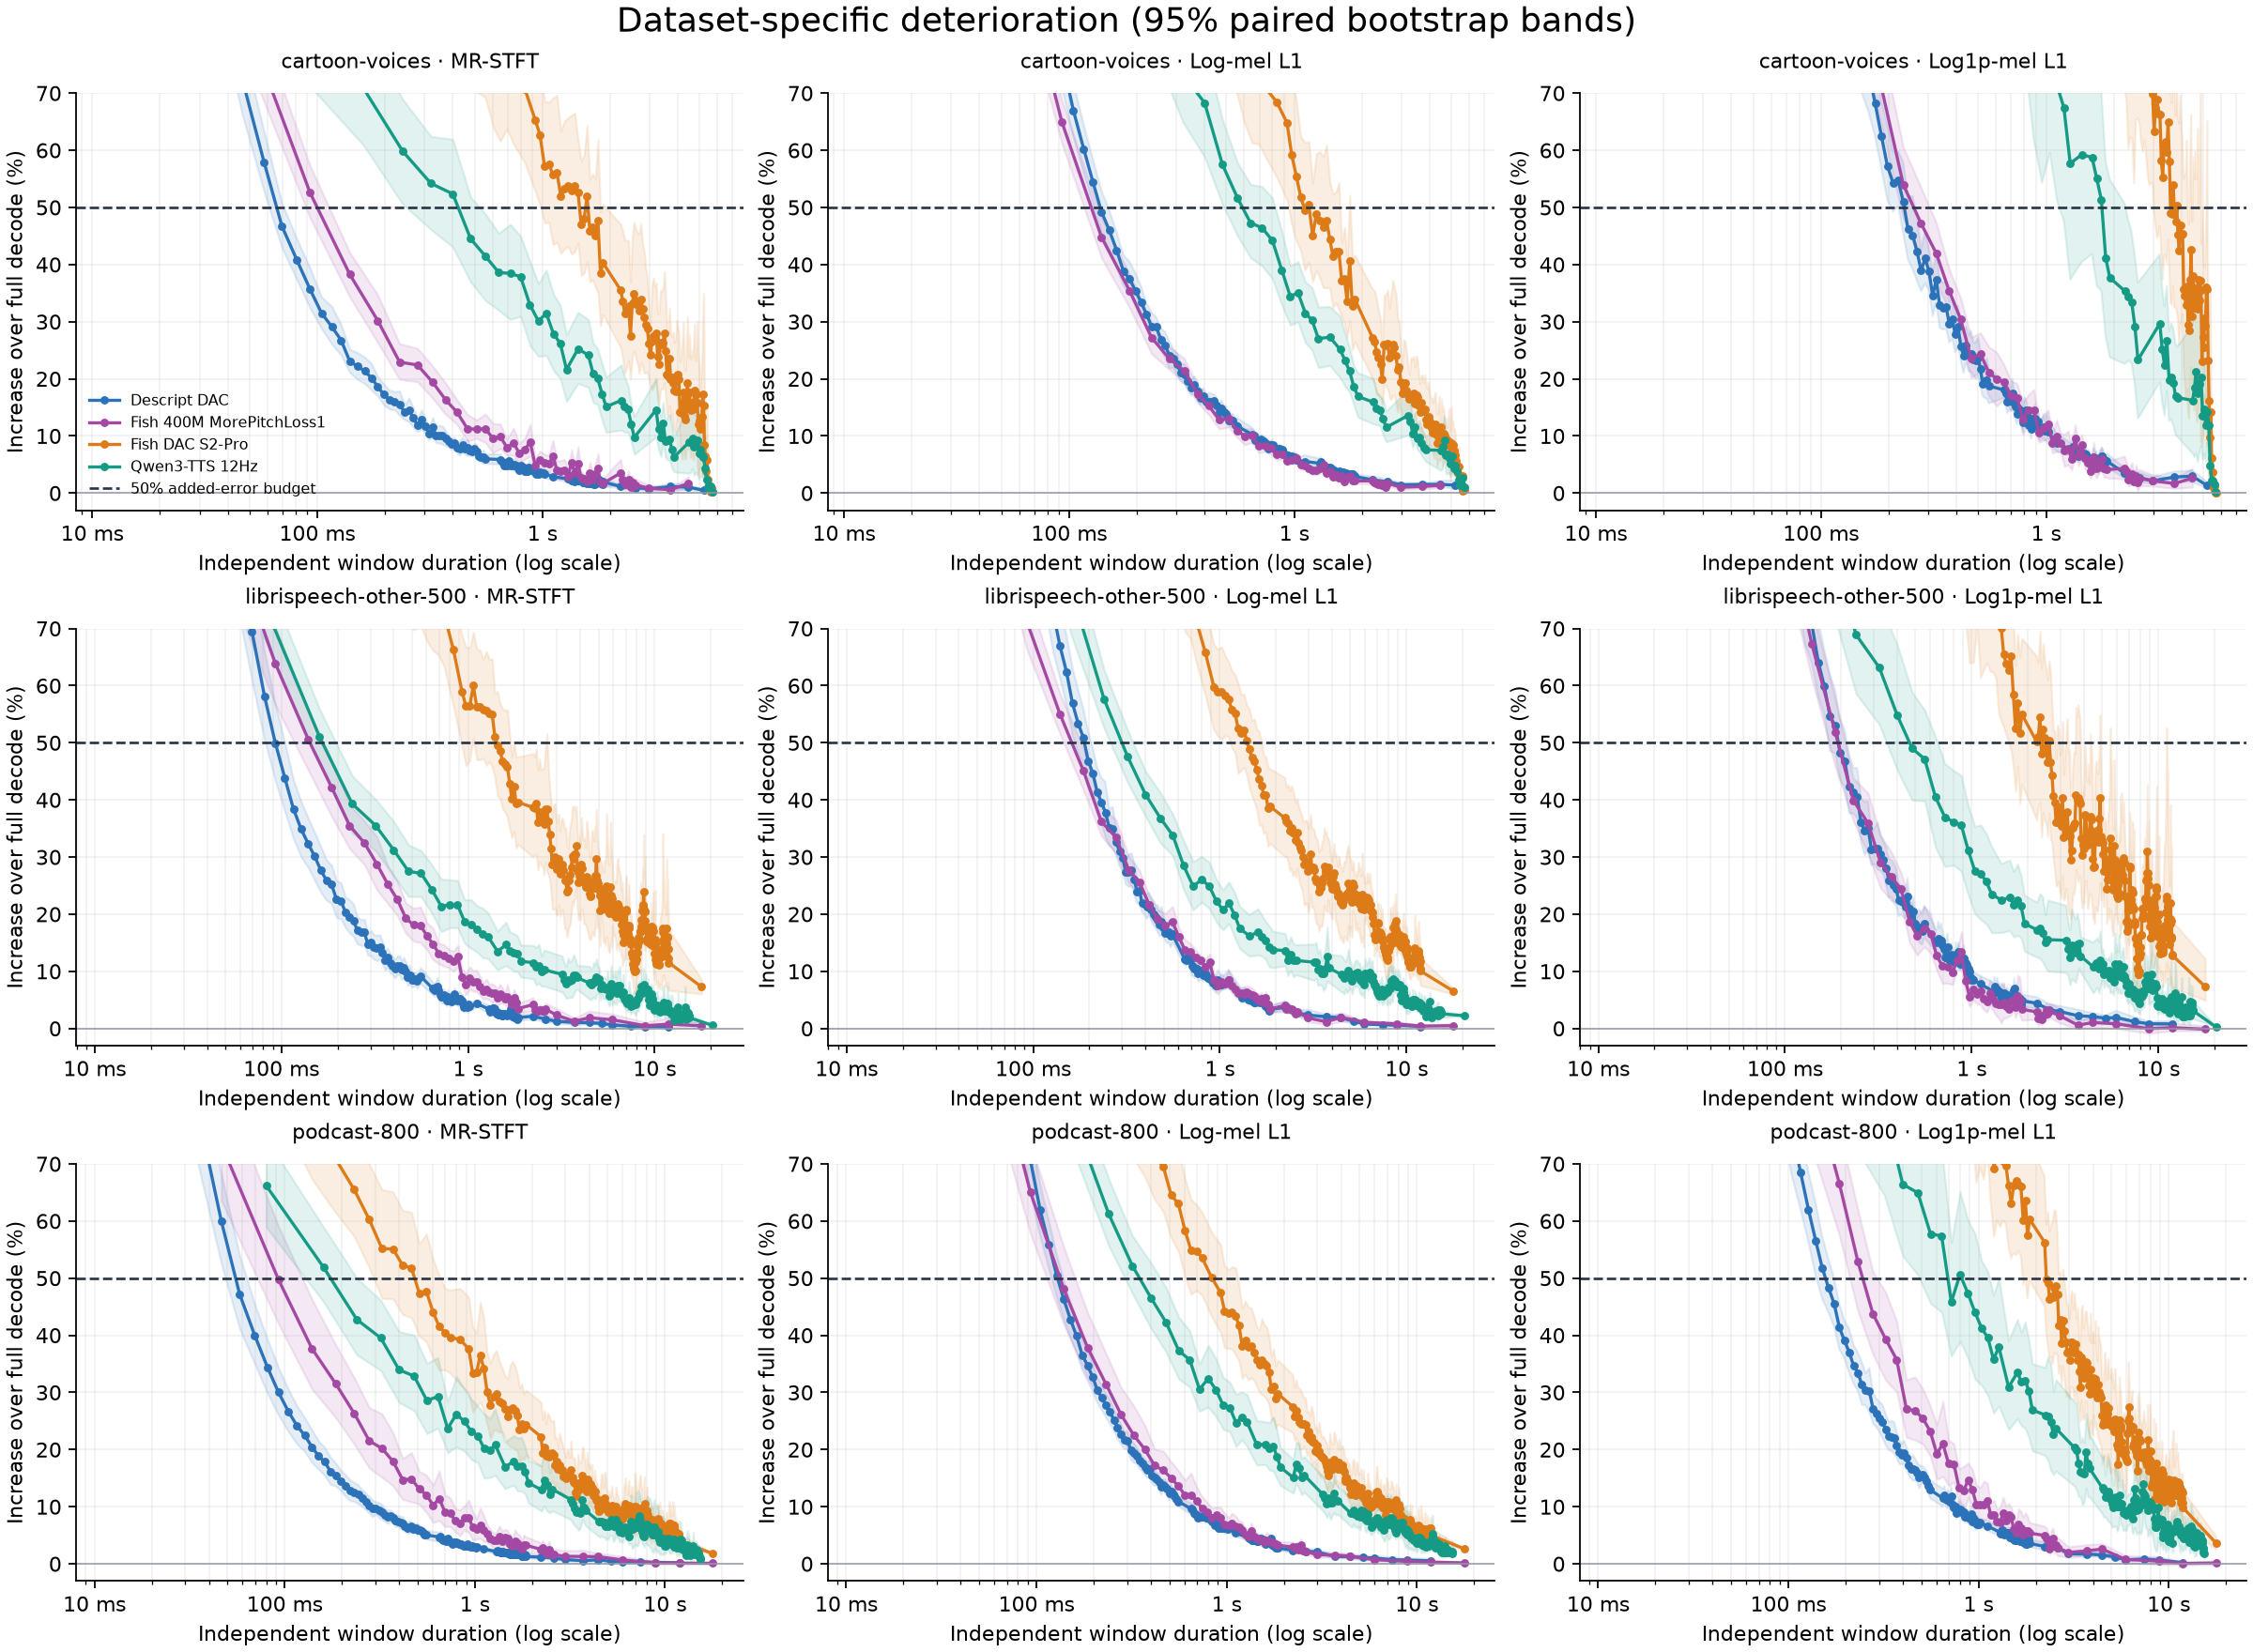 Dataset means and confidence bands expose subgroup differences. Each panel uses its own eligible clips.
Subgroup thresholds use the observed sweep; integer refinements target the pooled primary endpoint. Subgroup brackets can therefore be wider.
| Codec | Dataset | Metric | 50% fail/pass frames | ms | Pass CI % | Clips |
|---|
| Descript DAC | cartoon-voices | Log1p-mel L1 | (22, 23] | 267.0 | [37.1, 48.4] | 20 |
| Descript DAC | cartoon-voices | Log-mel L1 | (12, 13] | 150.9 | [42.6, 49.5] | 20 |
| Descript DAC | cartoon-voices | MR-STFT | (6, 7] | 81.3 | [37.3, 44.5] | 20 |
| Descript DAC | librispeech-other-500 | Log1p-mel L1 | (18, 19] | 220.6 | [37.6, 48.0] | 20 |
| Descript DAC | librispeech-other-500 | Log-mel L1 | (17, 18] | 209.0 | [40.7, 49.0] | 20 |
| Descript DAC | librispeech-other-500 | MR-STFT | (9, 10] | 116.1 | [33.2, 43.6] | 20 |
| Descript DAC | podcast-800 | Log1p-mel L1 | (14, 15] | 174.1 | [41.5, 50.0] | 20 |
| Descript DAC | podcast-800 | Log-mel L1 | (11, 12] | 139.3 | [42.7, 49.8] | 20 |
| Descript DAC | podcast-800 | MR-STFT | (5, 6] | 69.7 | [35.0, 45.5] | 20 |
| Fish 400M MorePitchLoss1 | cartoon-voices | Log1p-mel L1 | (6, 7] | 325.1 | [36.8, 47.3] | 20 |
| Fish 400M MorePitchLoss1 | cartoon-voices | Log-mel L1 | (2, 3] | 139.3 | [41.1, 48.2] | 20 |
| Fish 400M MorePitchLoss1 | cartoon-voices | MR-STFT | (2, 3] | 139.3 | [34.3, 42.1] | 20 |
| Fish 400M MorePitchLoss1 | librispeech-other-500 | Log1p-mel L1 | (4, 5] | 232.2 | [36.3, 43.9] | 20 |
| Fish 400M MorePitchLoss1 | librispeech-other-500 | Log-mel L1 | (3, 4] | 185.8 | [41.7, 49.1] | 20 |
| Fish 400M MorePitchLoss1 | librispeech-other-500 | MR-STFT | (3, 4] | 185.8 | [37.2, 47.1] | 20 |
| Fish 400M MorePitchLoss1 | podcast-800 | Log1p-mel L1 | (6, 7] | 325.1 | [32.1, 47.5] | 20 |
| Fish 400M MorePitchLoss1 | podcast-800 | Log-mel L1 | (3, 4] | 185.8 | [32.6, 44.0] | 20 |
| Fish 400M MorePitchLoss1 | podcast-800 | MR-STFT | (2, 3] | 139.3 | [30.6, 46.3] | 20 |
| Fish DAC S2-Pro | cartoon-voices | Log1p-mel L1 | (112, 113] | 5247.7 | [9.4, 36.5] | 4 |
| Fish DAC S2-Pro | cartoon-voices | Log-mel L1 | (38, 39] | 1811.2 | [25.0, 41.4] | 20 |
| Fish DAC S2-Pro | cartoon-voices | MR-STFT | (40, 48] | 2229.1 | [25.4, 47.1] | 20 |
| Fish DAC S2-Pro | librispeech-other-500 | Log1p-mel L1 | (239, 240] | 11145.6 | [10.4, 47.7] | 6 |
| Fish DAC S2-Pro | librispeech-other-500 | Log-mel L1 | (35, 36] | 1671.8 | [35.6, 50.0] | 20 |
| Fish DAC S2-Pro | librispeech-other-500 | MR-STFT | (57, 58] | 2693.5 | [26.9, 46.2] | 18 |
| Fish DAC S2-Pro | podcast-800 | Log1p-mel L1 | (61, 62] | 2879.3 | [30.3, 47.7] | 20 |
| Fish DAC S2-Pro | podcast-800 | Log-mel L1 | (24, 25] | 1161.0 | [35.5, 48.9] | 20 |
| Fish DAC S2-Pro | podcast-800 | MR-STFT | (14, 15] | 696.6 | [34.0, 48.2] | 20 |
| Qwen3-TTS 12Hz | cartoon-voices | Log1p-mel L1 | (28, 29] | 2320.0 | [23.2, 47.7] | 20 |
| Qwen3-TTS 12Hz | cartoon-voices | Log-mel L1 | (10, 11] | 880.0 | [32.9, 45.9] | 20 |
| Qwen3-TTS 12Hz | cartoon-voices | MR-STFT | (6, 7] | 560.0 | [33.6, 48.8] | 20 |
| Qwen3-TTS 12Hz | librispeech-other-500 | Log1p-mel L1 | (8, 9] | 720.0 | [28.3, 46.3] | 20 |
| Qwen3-TTS 12Hz | librispeech-other-500 | Log-mel L1 | (4, 5] | 400.0 | [37.1, 45.0] | 20 |
| Qwen3-TTS 12Hz | librispeech-other-500 | MR-STFT | (2, 3] | 240.0 | [34.2, 44.2] | 20 |
| Qwen3-TTS 12Hz | podcast-800 | Log1p-mel L1 | (16, 18] | 1440.0 | [23.5, 39.1] | 20 |
| Qwen3-TTS 12Hz | podcast-800 | Log-mel L1 | (5, 6] | 480.0 | [37.1, 48.4] | 20 |
| Qwen3-TTS 12Hz | podcast-800 | MR-STFT | (2, 3] | 240.0 | [36.6, 50.0] | 20 |
Clip-to-clip ranges
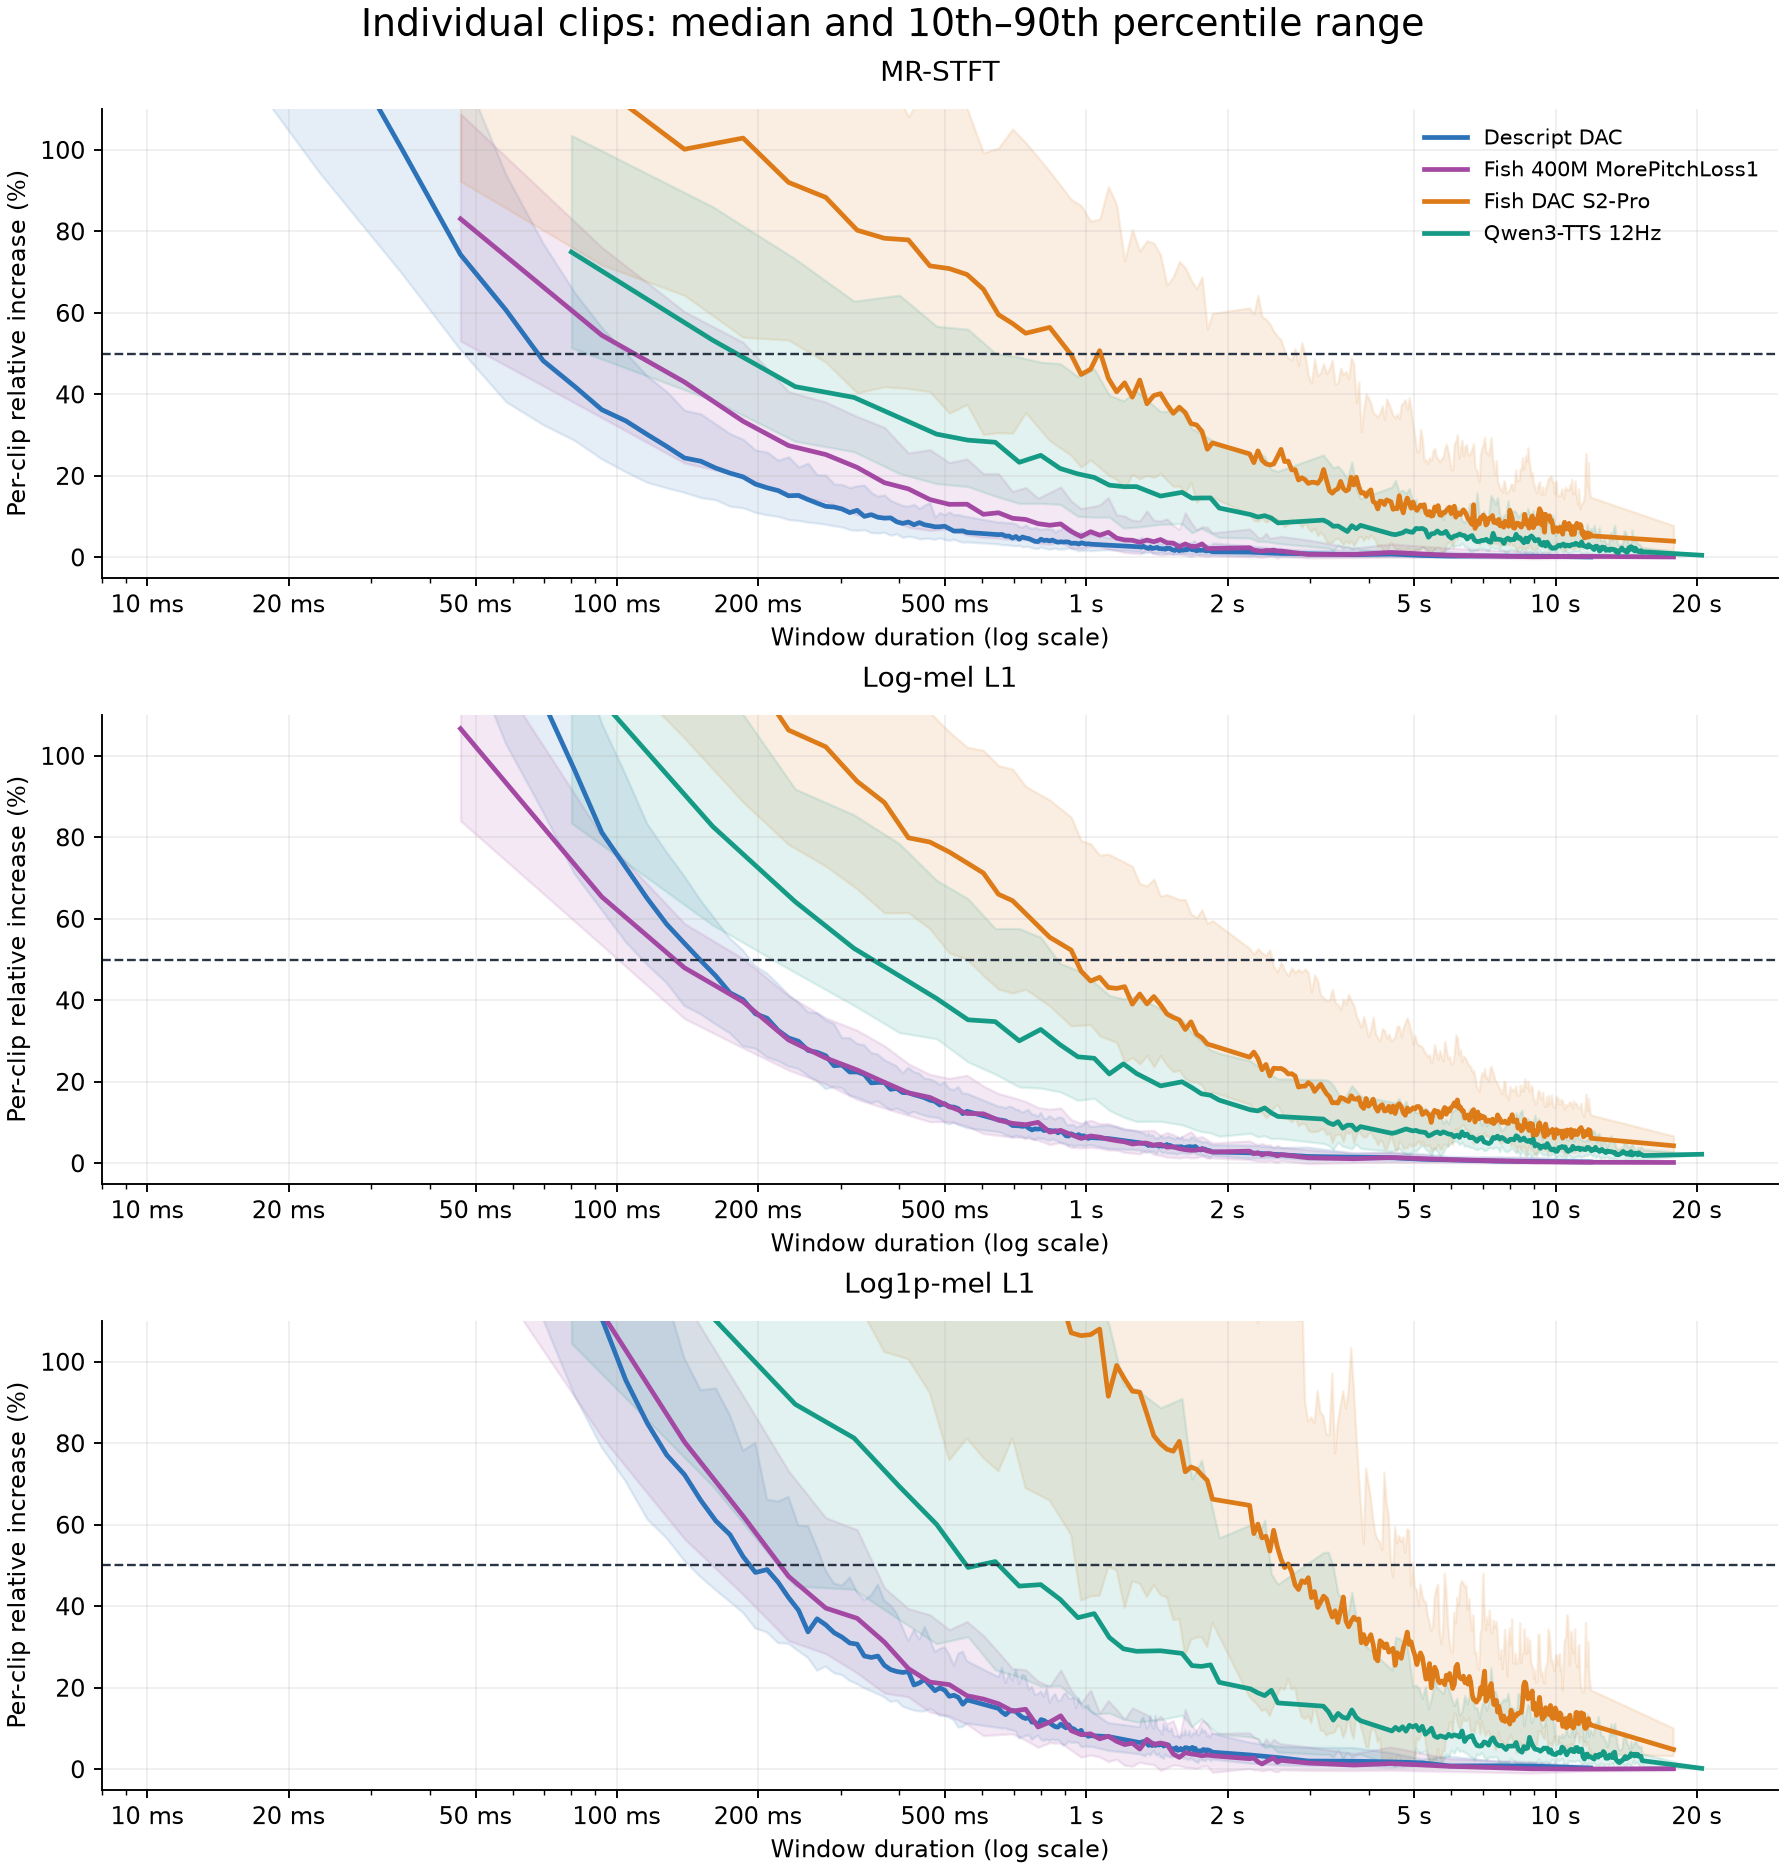 Shading is the 10th–90th percentile of individual clip error increases, not a confidence interval. The vertical view is limited to −5% through 110%; the CSV retains all extrema.
Mean error ratios and averages of per-clip percentages are different statistics. The primary endpoint is the ratio of arithmetic means. The distribution plot uses individual clip ratios to show the spread; the raw aggregate file additionally includes minima and maxima.
Numerical ranges at each metric’s conservative 50% threshold
| Codec | Metric | Frames | Median % | P10 % | P90 % | Min % | Max % |
|---|
| Descript DAC | Log1p-mel L1 | 17 | 48.3 | 34.6 | 80.1 | 26.6 | 89.3 |
| Descript DAC | Log-mel L1 | 14 | 46.0 | 34.1 | 59.7 | 25.8 | 86.9 |
| Descript DAC | MR-STFT | 7 | 42.0 | 28.7 | 65.0 | 16.1 | 98.7 |
| Fish 400M MorePitchLoss1 | Log1p-mel L1 | 6 | 39.5 | 28.4 | 61.7 | 12.2 | 80.9 |
| Fish 400M MorePitchLoss1 | Log-mel L1 | 4 | 39.6 | 28.3 | 50.2 | 21.5 | 72.3 |
| Fish 400M MorePitchLoss1 | MR-STFT | 3 | 43.0 | 23.2 | 60.3 | 19.5 | 85.1 |
| Fish DAC S2-Pro | Log1p-mel L1 | 76 | 42.3 | 7.8 | 92.8 | -0.0 | 233.2 |
| Fish DAC S2-Pro | Log-mel L1 | 31 | 38.9 | 26.4 | 65.6 | 18.0 | 106.7 |
| Fish DAC S2-Pro | MR-STFT | 31 | 40.2 | 20.7 | 74.3 | 9.7 | 99.6 |
| Qwen3-TTS 12Hz | Log1p-mel L1 | 15 | 29.6 | 12.3 | 94.3 | 3.0 | 197.0 |
| Qwen3-TTS 12Hz | Log-mel L1 | 6 | 40.4 | 30.6 | 69.5 | 18.5 | 104.8 |
| Qwen3-TTS 12Hz | MR-STFT | 4 | 39.3 | 25.9 | 62.9 | 18.1 | 97.9 |
These are individual clip percentages. They need not fall inside the confidence interval of the pooled ratio, and the maximum can exceed 50% even when the pooled conservative criterion passes.
Stricter observed per-clip caps at 50%
The primary confidence-bound rule limits the pooled average. The following alternatives constrain the measured individual clip distribution: its 90th percentile, or its maximum. Each rule also requires every larger measured window to pass. These are empirical sample caps, without a population confidence guarantee; eligible sample size changes with window length.
| Codec | Metric | P90 cap: frames / ms | Clips | Maximum cap: frames / ms | Clips |
|---|
| Descript DAC | MR-STFT | 10 / 116.1 ms | 60 | 14 / 162.5 ms | 60 |
| Descript DAC | Log-mel L1 | 17 / 197.4 ms | 60 | 24 / 278.6 ms | 60 |
| Descript DAC | Log1p-mel L1 | 24 / 278.6 ms | 60 | 41 / 476.0 ms | 60 |
| Fish 400M MorePitchLoss1 | MR-STFT | 5 / 232.2 ms | 60 | 8 / 371.5 ms | 60 |
| Fish 400M MorePitchLoss1 | Log-mel L1 | 5 / 232.2 ms | 60 | 8 / 371.5 ms | 60 |
| Fish 400M MorePitchLoss1 | Log1p-mel L1 | 8 / 371.5 ms | 60 | 15 / 696.6 ms | 60 |
| Fish DAC S2-Pro | MR-STFT | 63 / 2925.7 ms | 58 | 240 / 11145.6 ms | 15 |
| Fish DAC S2-Pro | Log-mel L1 | 54 / 2507.8 ms | 58 | 84 / 3901.0 ms | 49 |
| Fish DAC S2-Pro | Log1p-mel L1 | 108 / 5015.5 ms | 32 | 252 / 11702.9 ms | 15 |
| Qwen3-TTS 12Hz | MR-STFT | 9 / 720.0 ms | 60 | 31 / 2480.0 ms | 58 |
| Qwen3-TTS 12Hz | Log-mel L1 | 11 / 880.0 ms | 60 | 23 / 1840.0 ms | 60 |
| Qwen3-TTS 12Hz | Log1p-mel L1 | 42 / 3360.0 ms | 57 | 66 / 5280.0 ms | 28 |
An actual spectrogram example
The following figures use the same Podcast 800 clip for all models: 04c87851-859c-4a3d-be14-b501dadb468b_seg00187_0001366305_0001375009. Each codec uses its joint conservative 50% window size. White marks in the difference panel indicate the hard joins. Display color scales match within each model and metric; difference color scales saturate at their 99th percentile. This is one example, so its individual error increase can exceed the pooled budget.
| Codec | Frames | Window ms | MR-STFT increase % | Log-mel increase % | Log1p-mel increase % |
|---|
| Descript DAC | 17 | 197.4 | 18.5 | 34.9 | 39.9 |
| Fish 400M MorePitchLoss1 | 6 | 278.6 | 30.6 | 32.3 | 55.1 |
| Fish DAC S2-Pro | 76 | 3529.4 | 13.3 | 19.4 | 24.3 |
| Qwen3-TTS 12Hz | 15 | 1200.0 | 15.9 | 23.8 | 24.7 |
Descript DAC — mel spectrograms
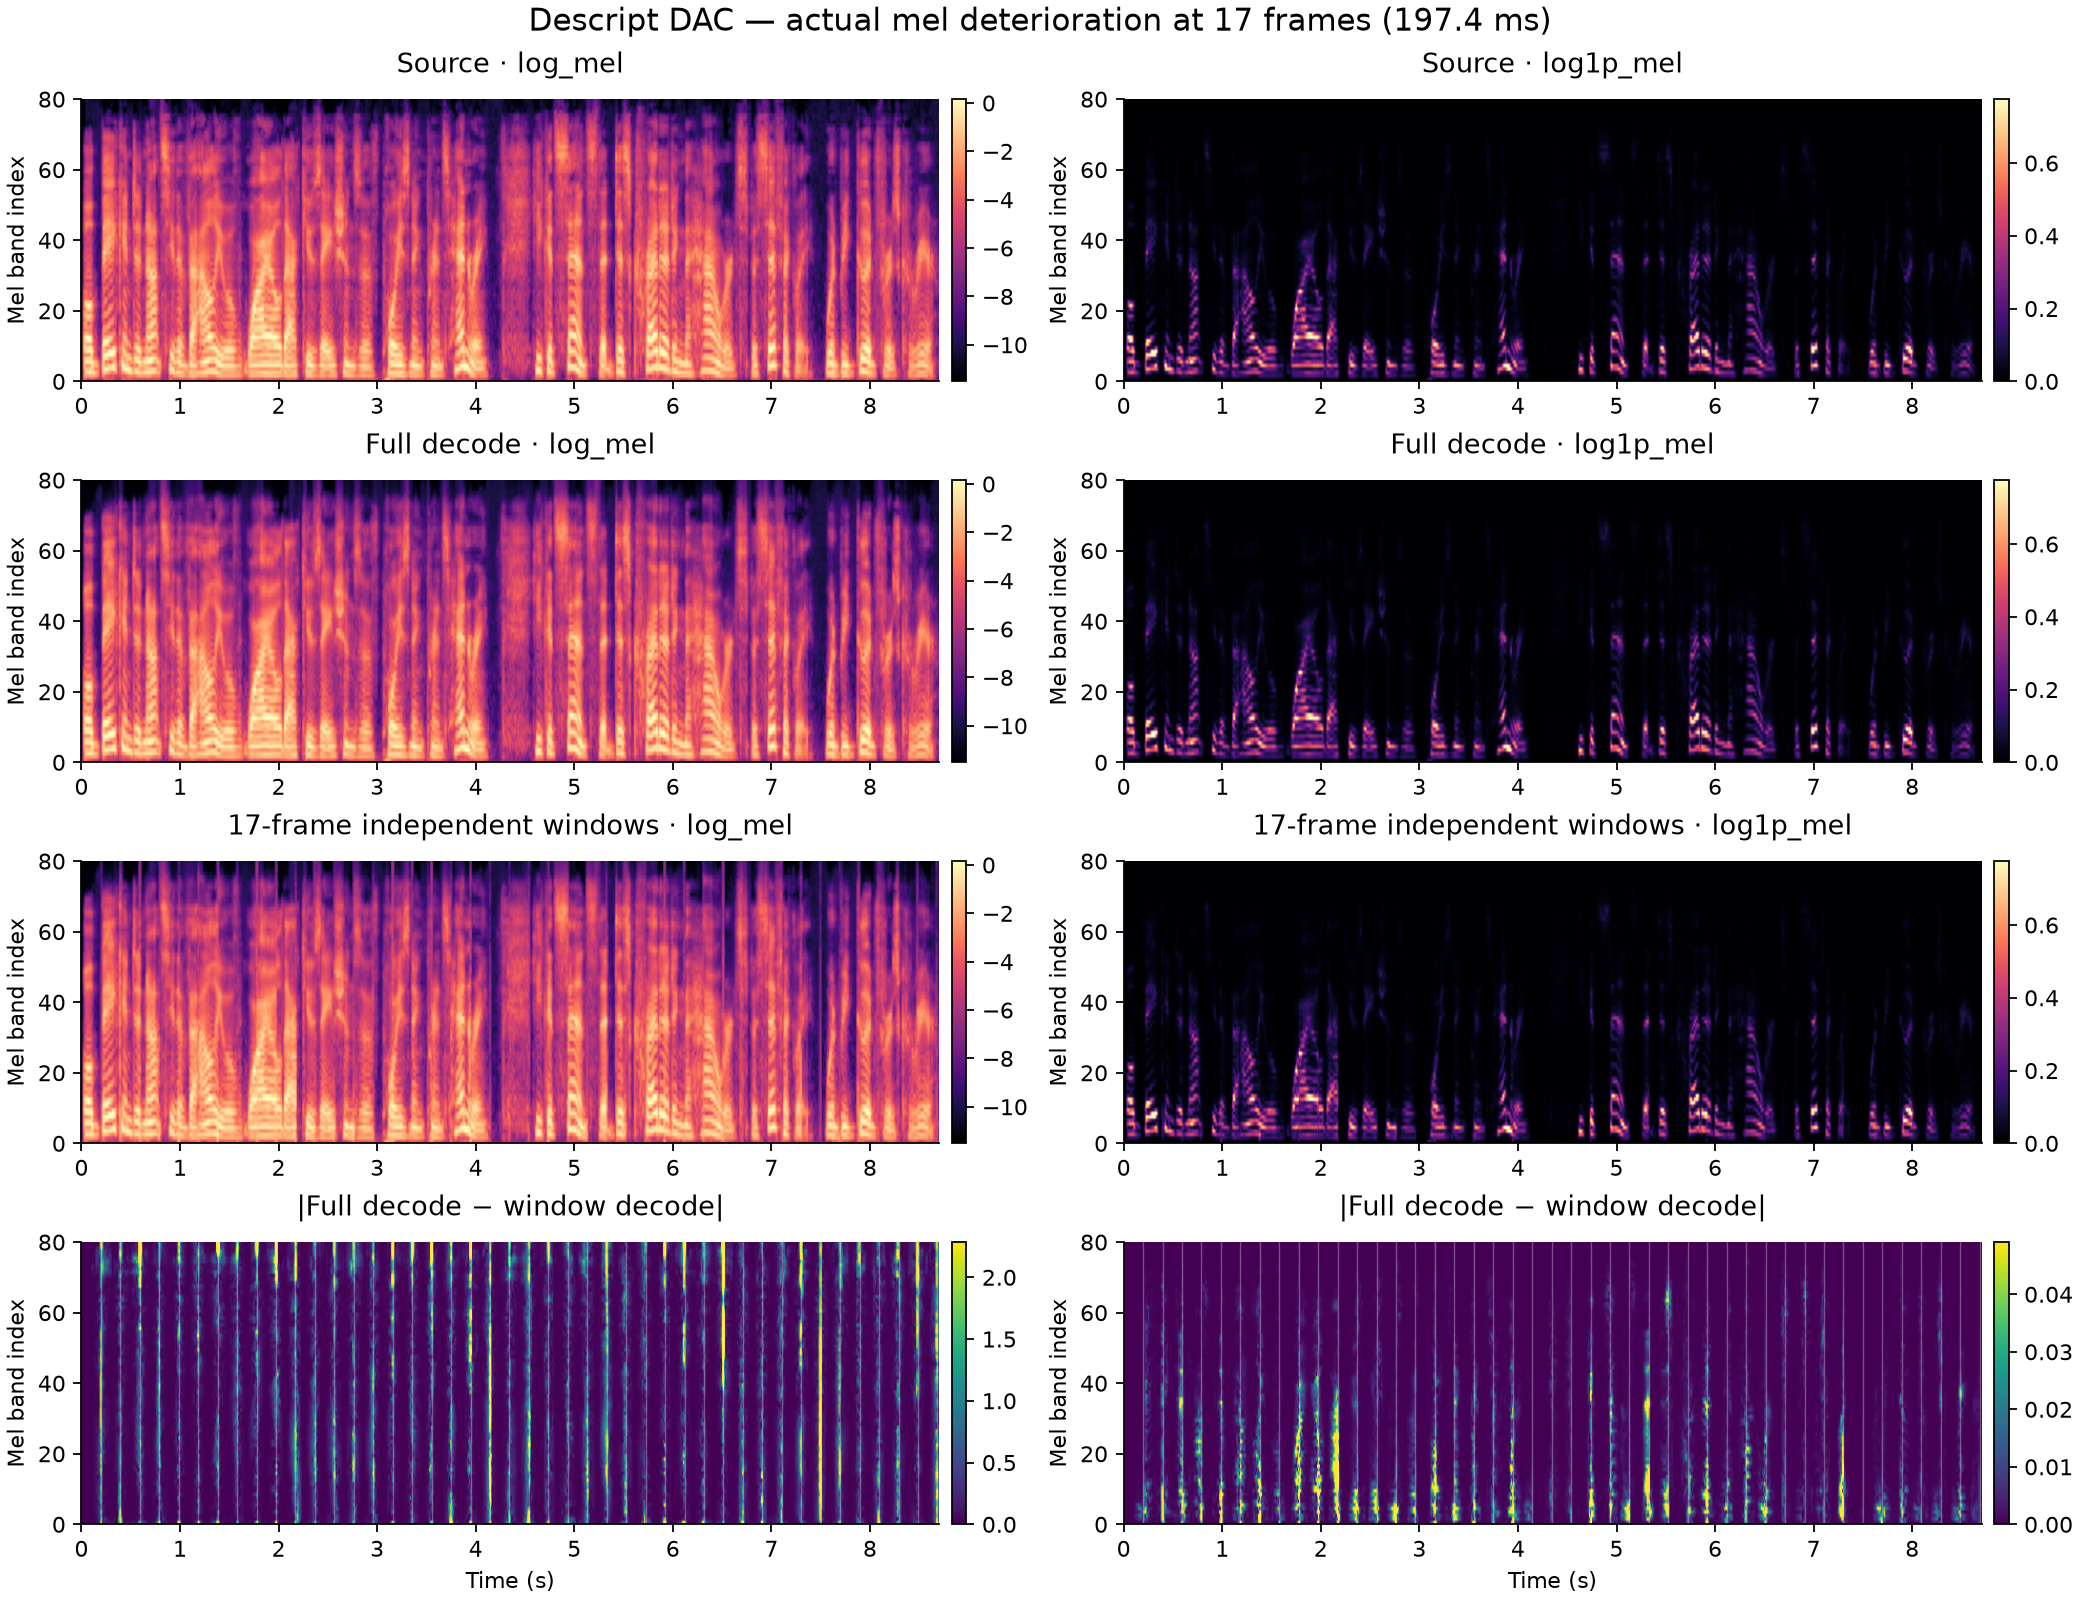 Left: log-mel; right: log1p-mel. The last row isolates the decoder-window effect.
Fish 400M MorePitchLoss1 — mel spectrograms
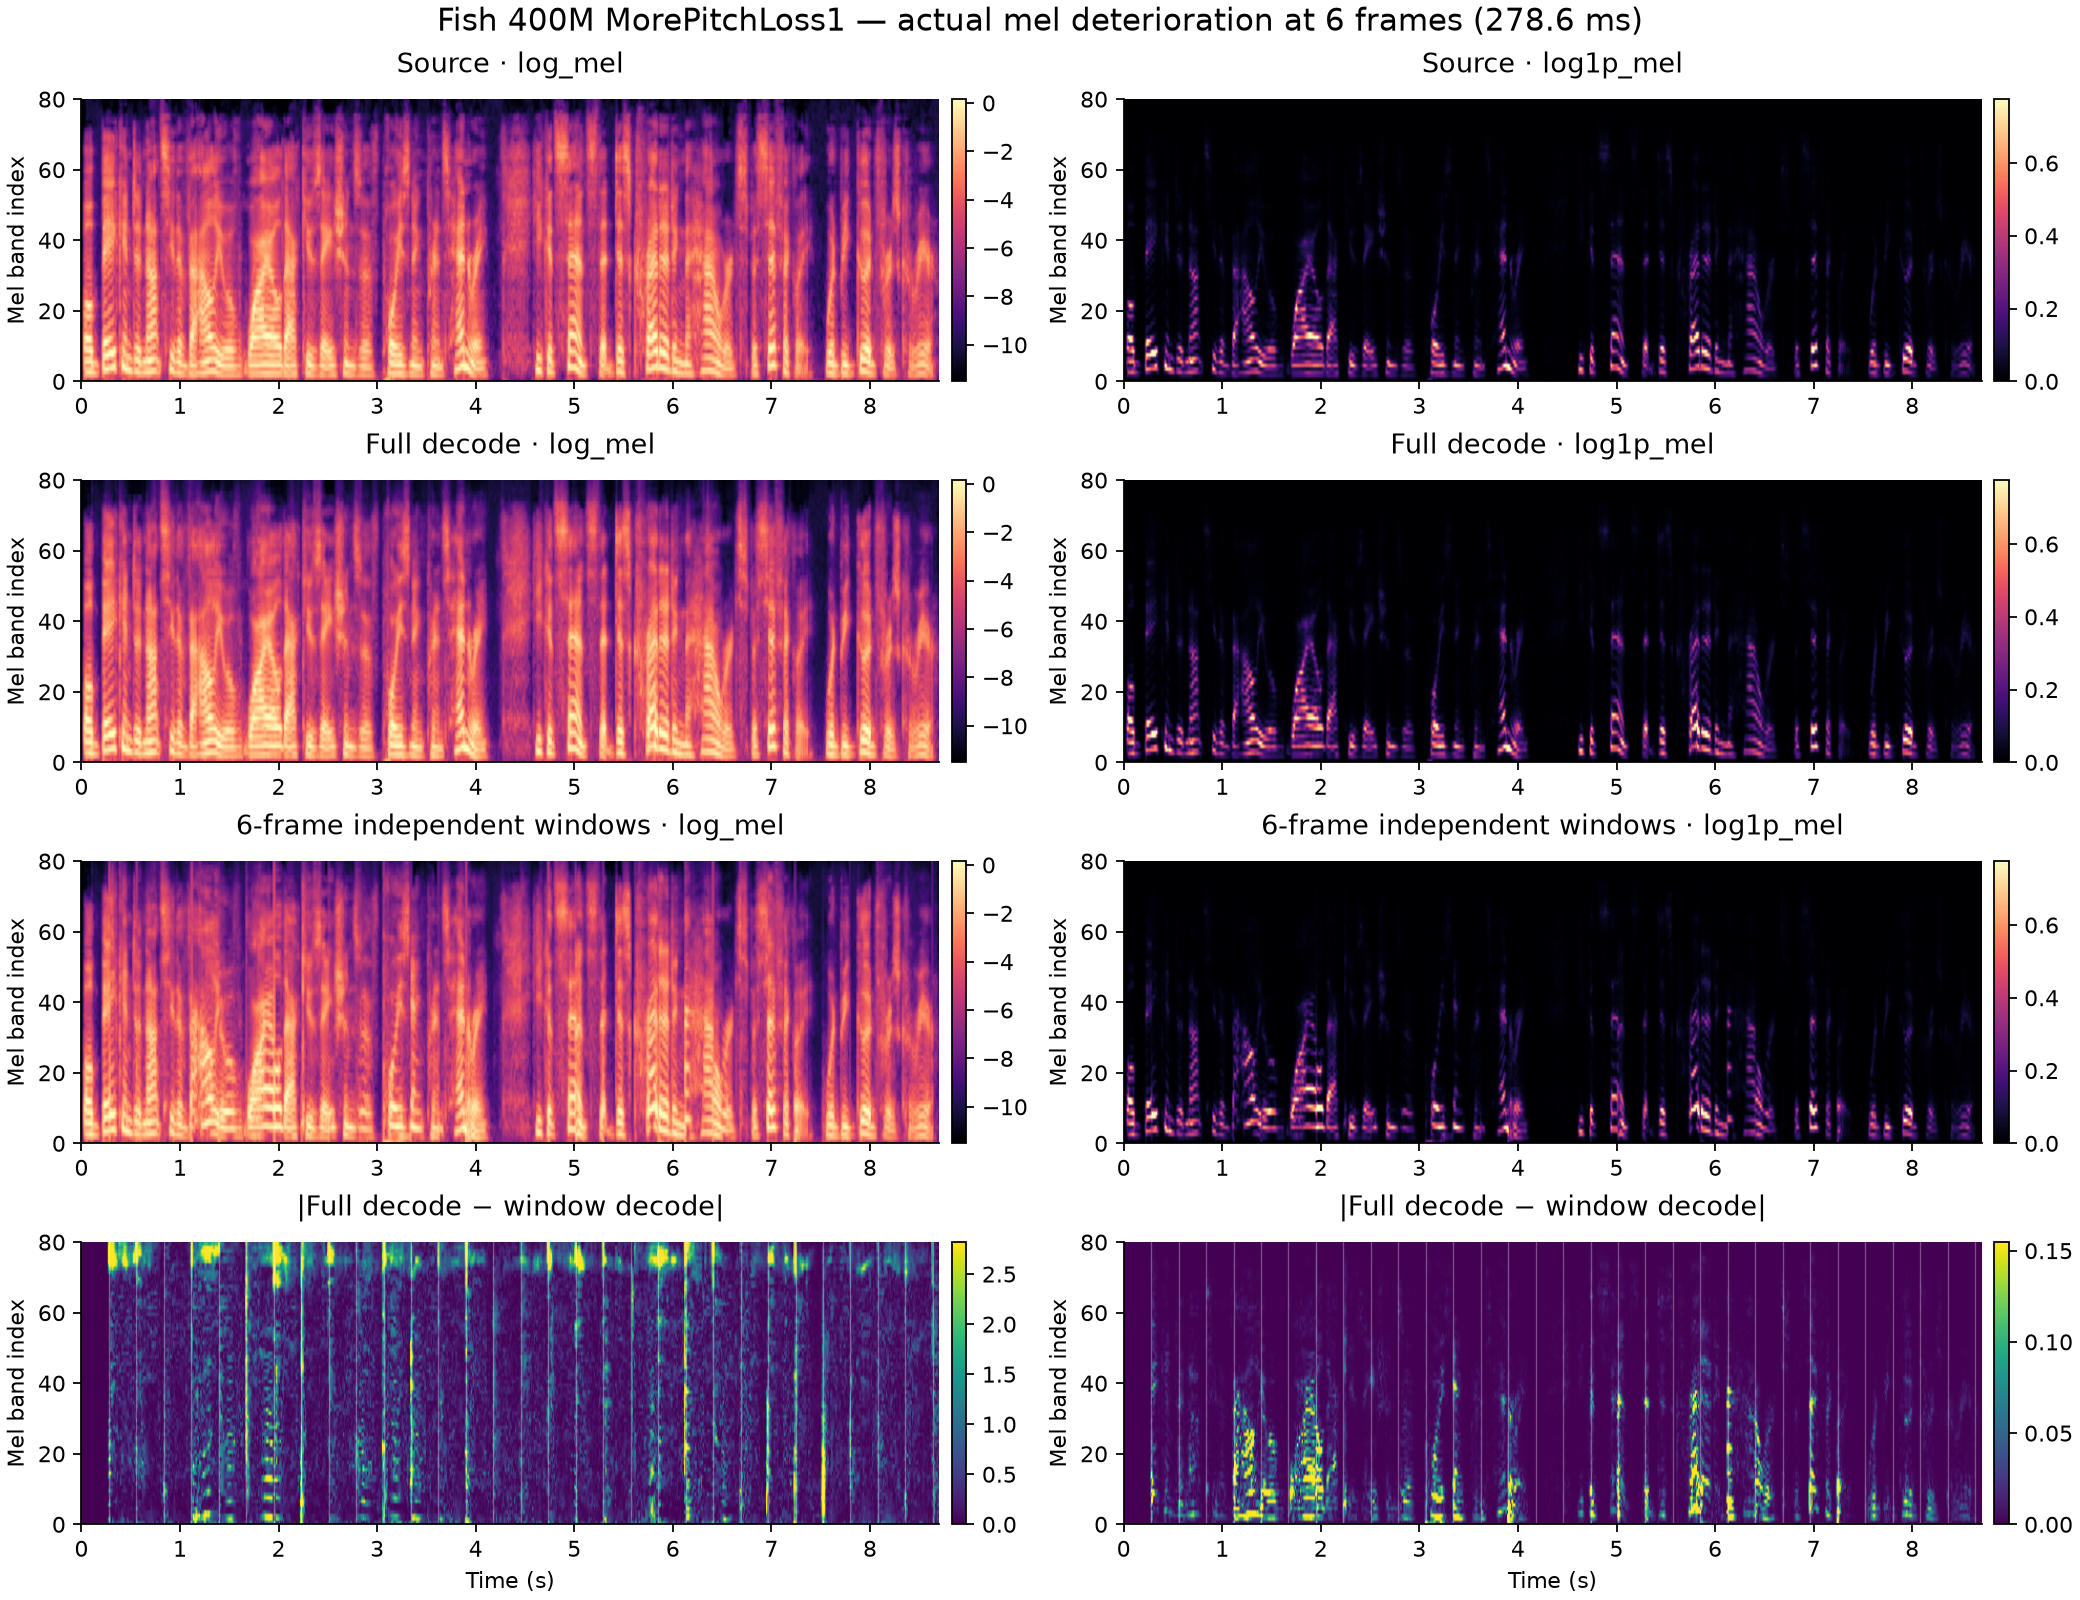 Left: log-mel; right: log1p-mel. The last row isolates the decoder-window effect.
Fish DAC S2-Pro — mel spectrograms
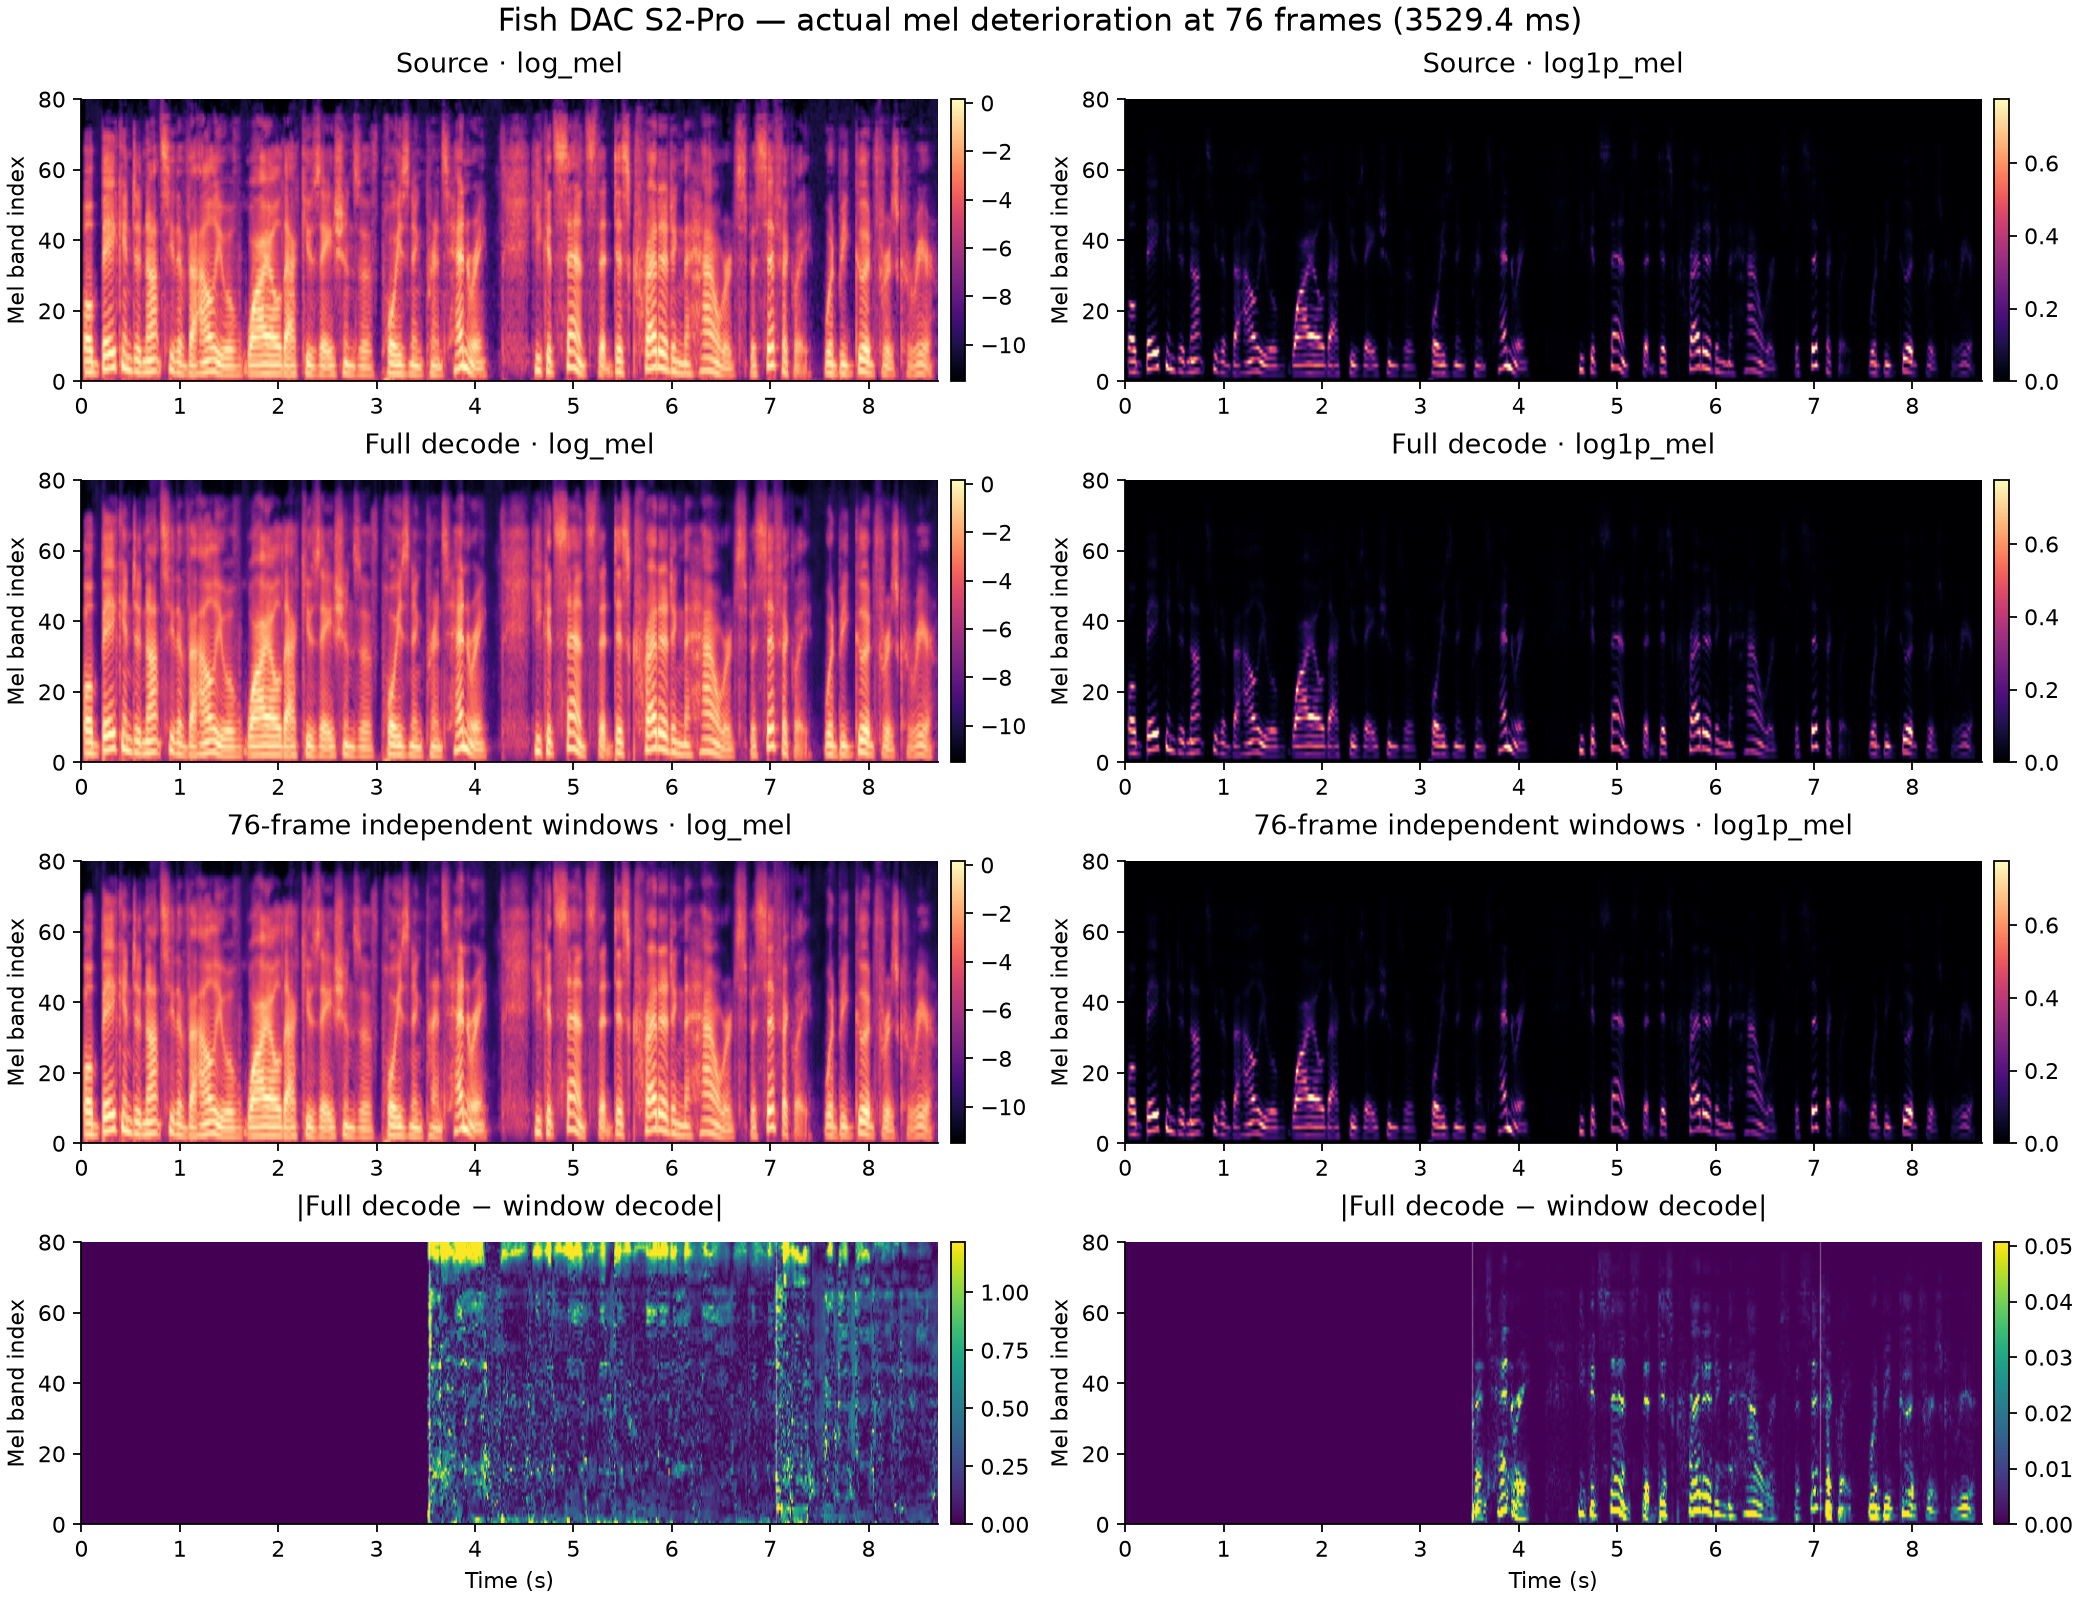 Left: log-mel; right: log1p-mel. The last row isolates the decoder-window effect.
Qwen3-TTS 12Hz — mel spectrograms
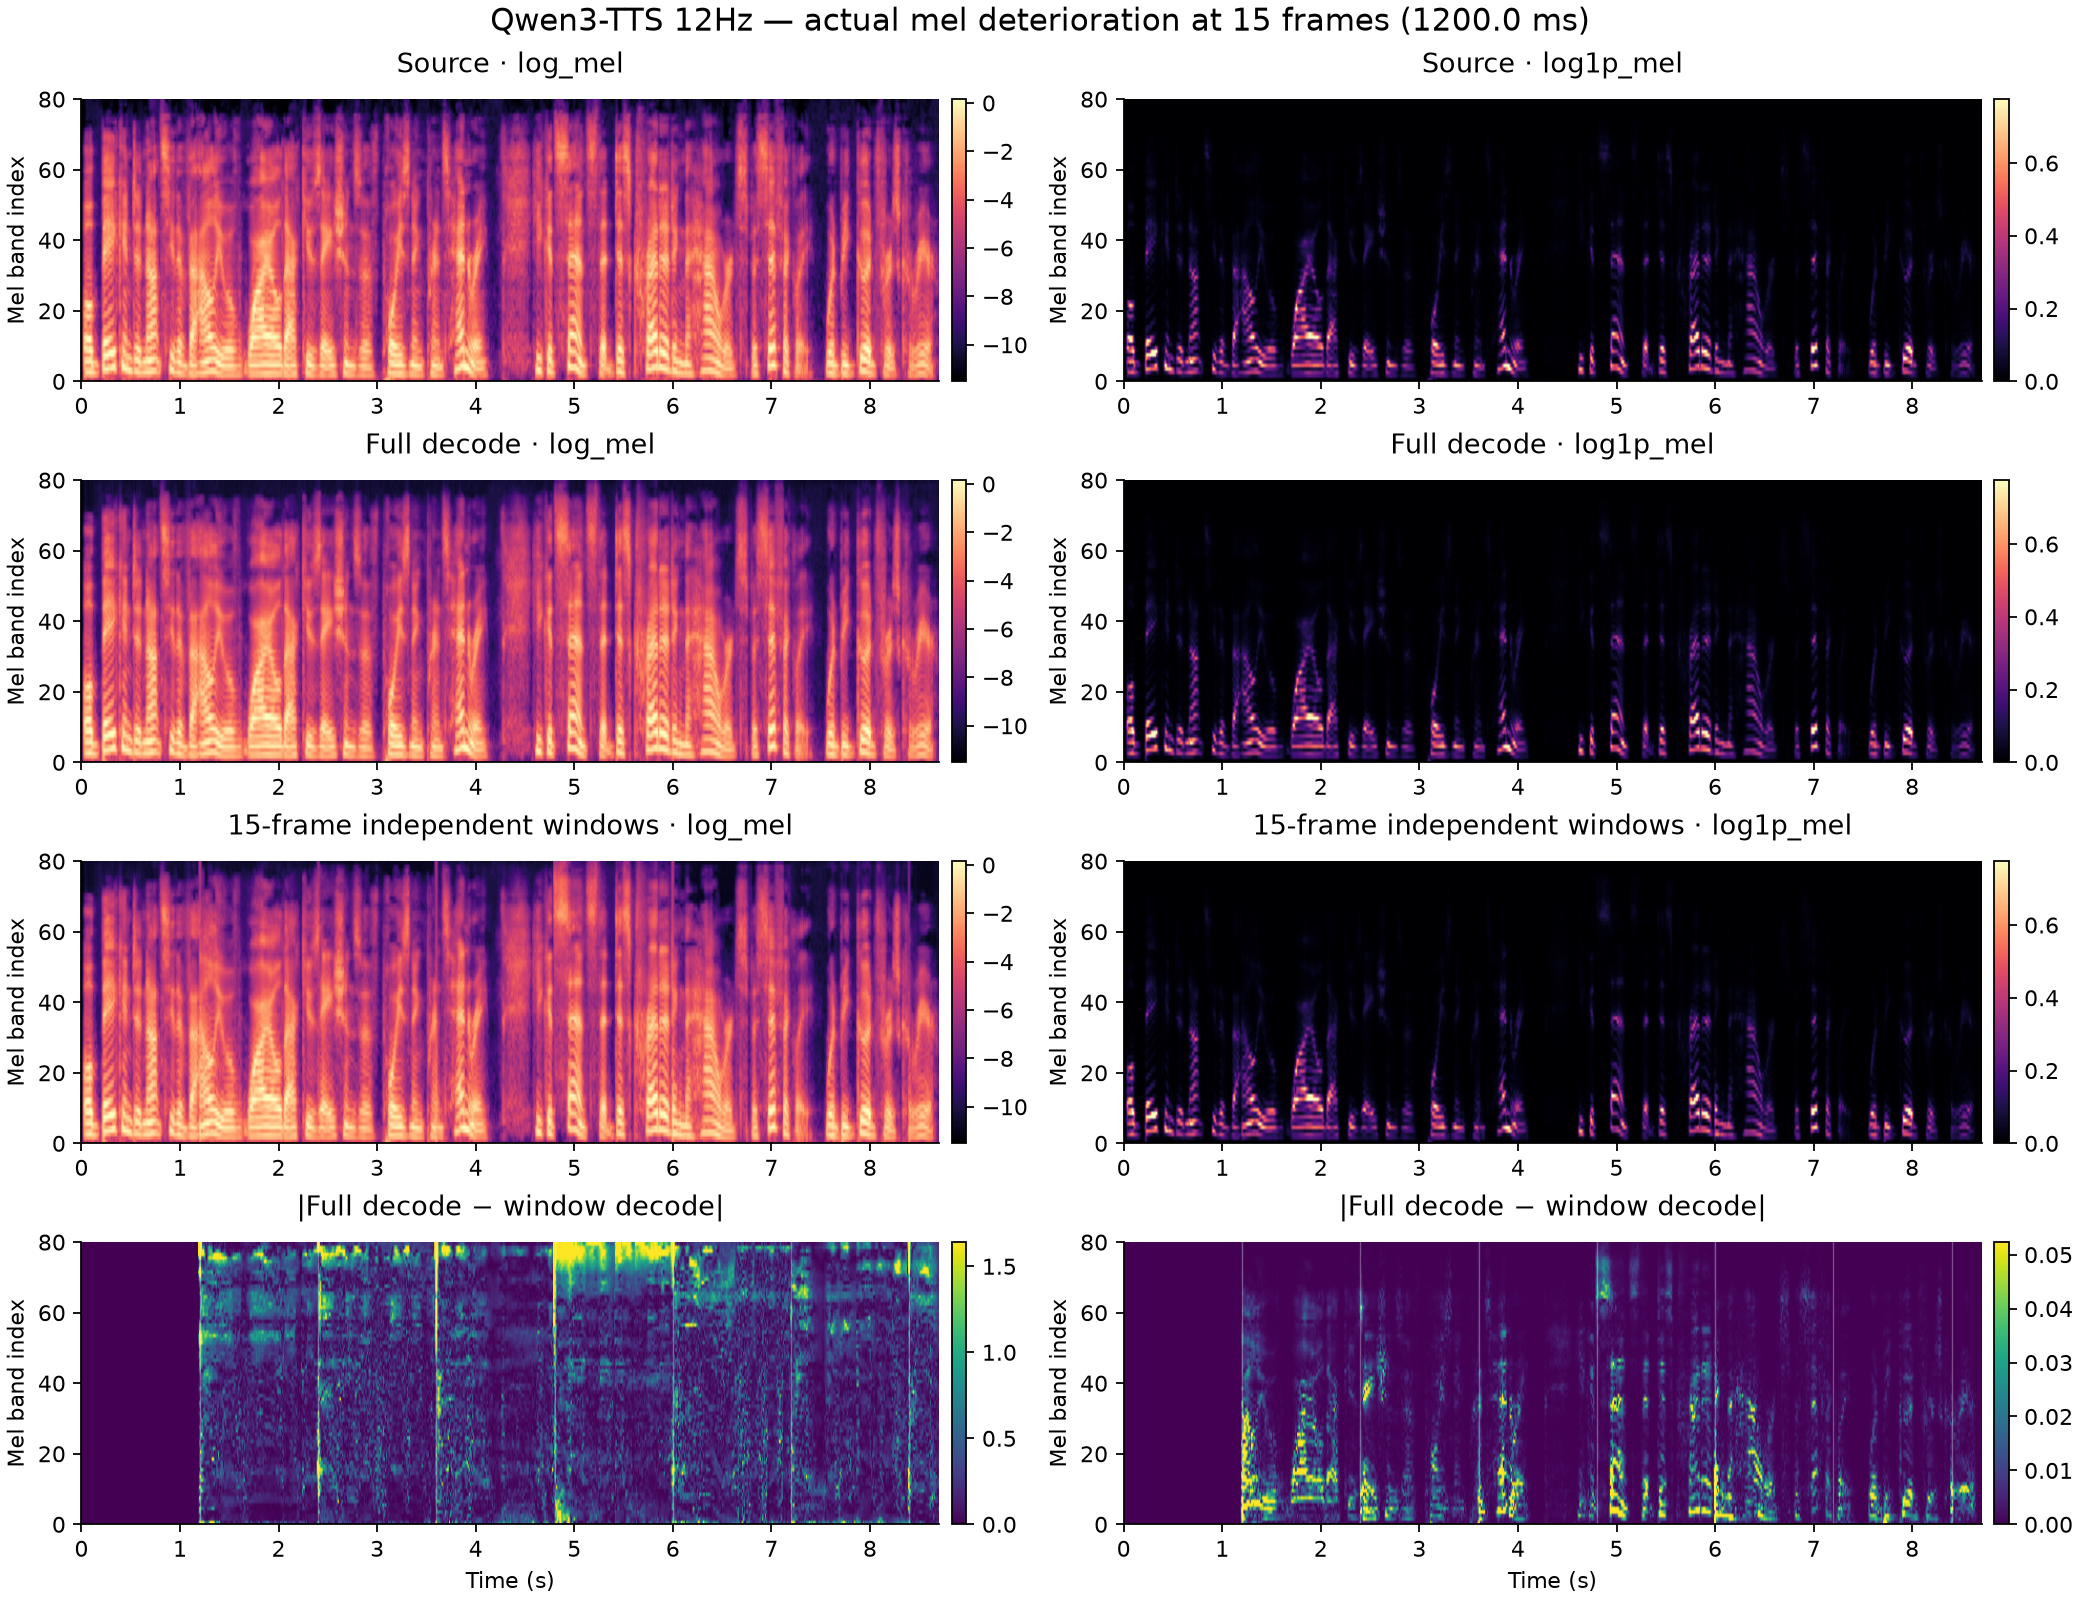 Left: log-mel; right: log1p-mel. The last row isolates the decoder-window effect.
Coverage and interpretation
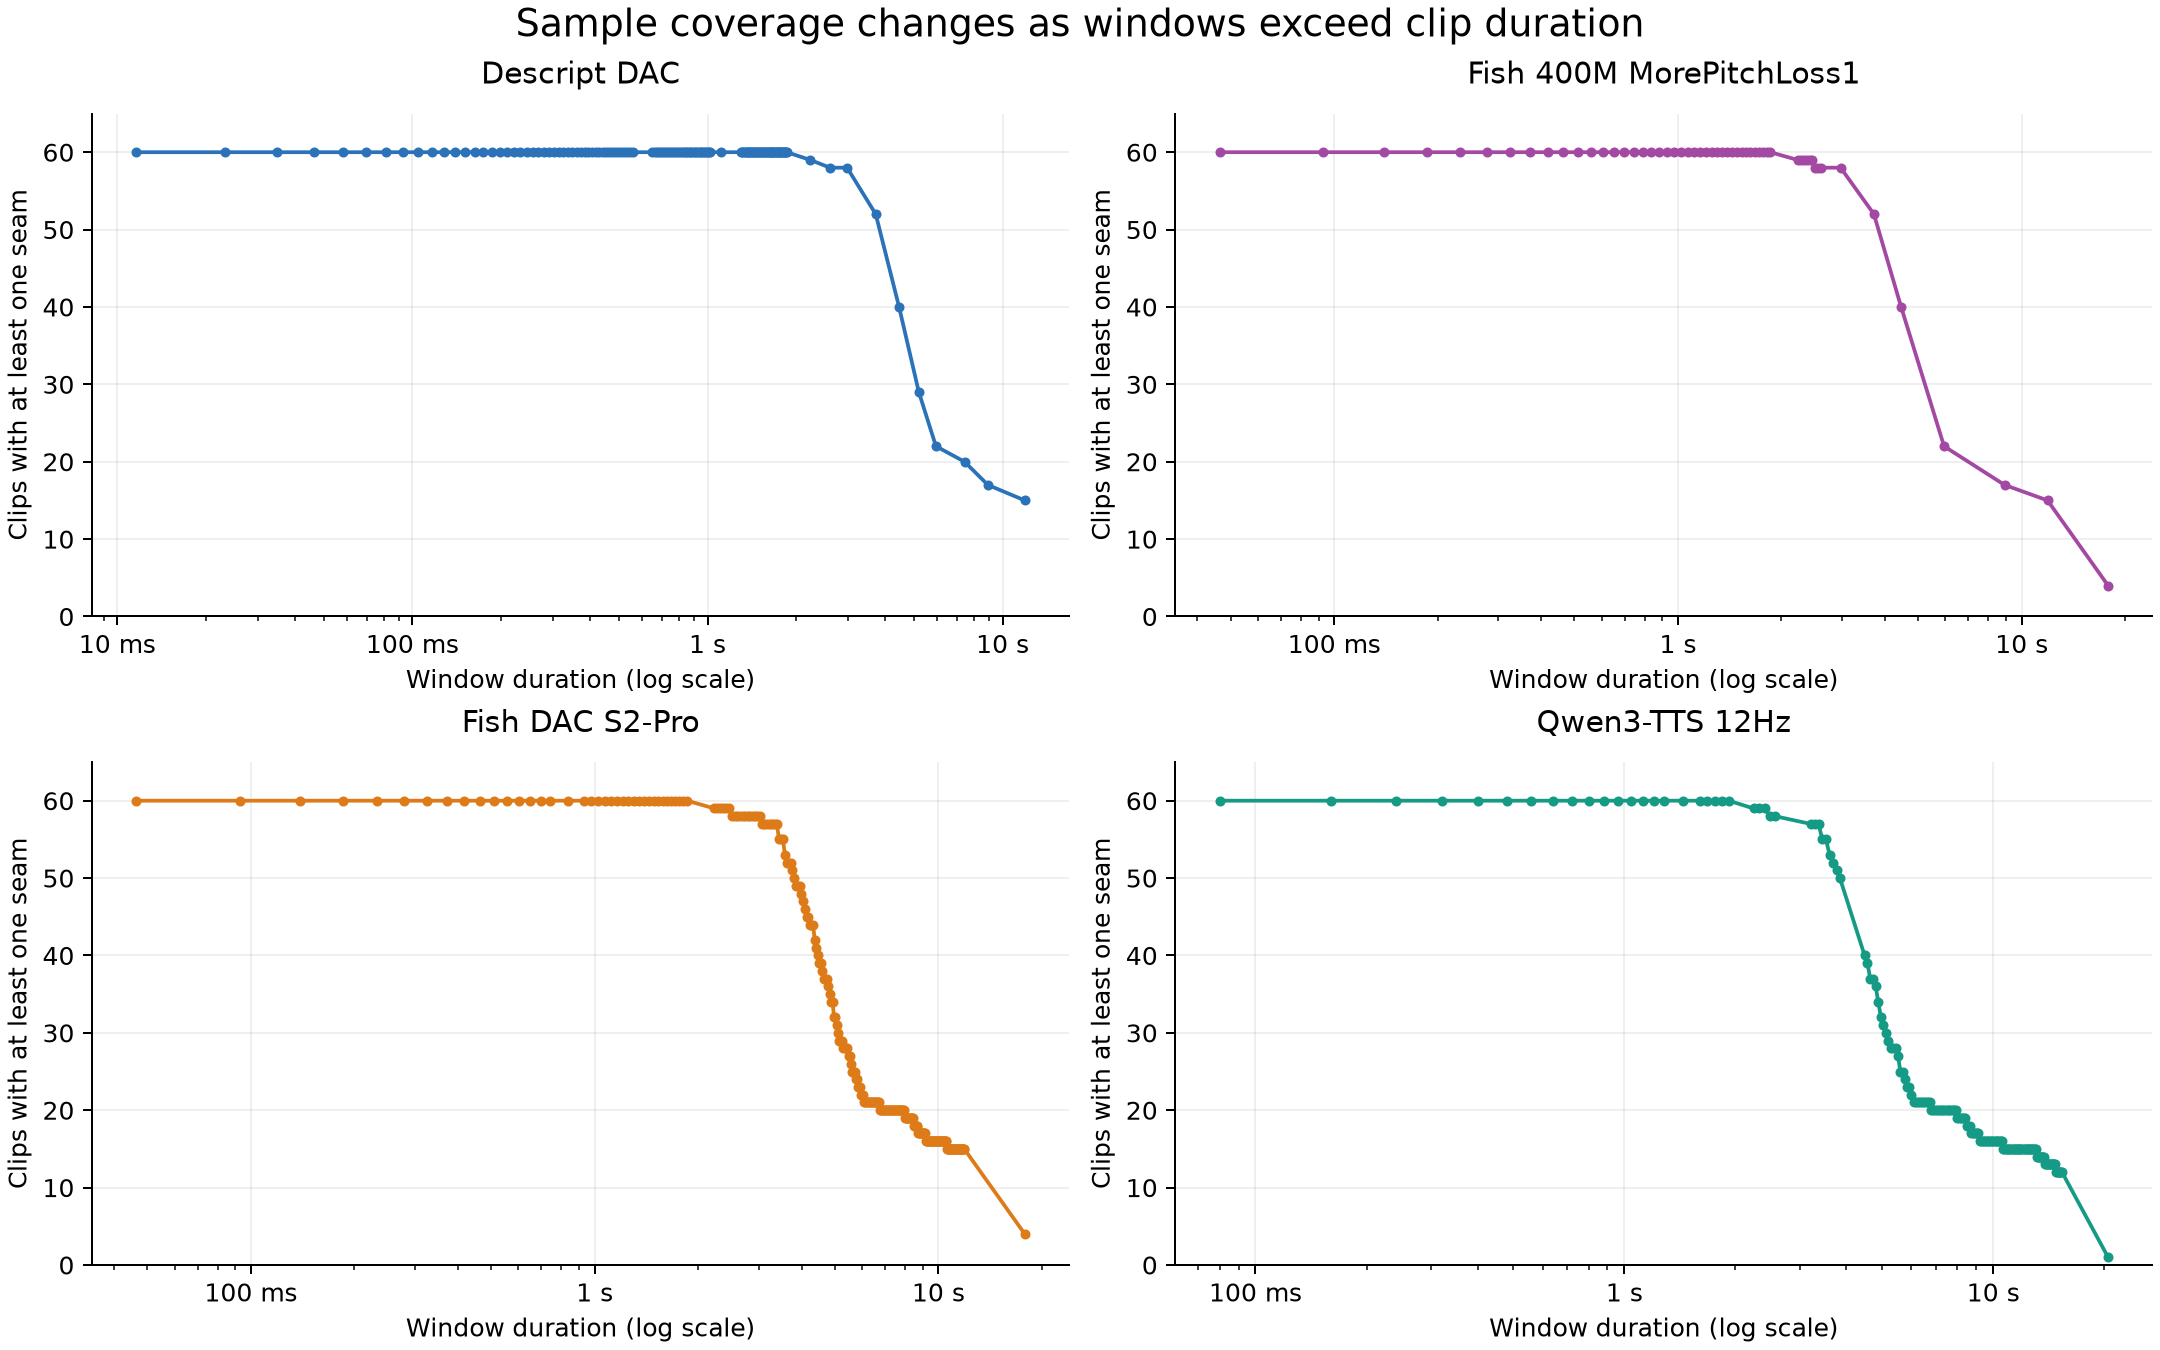 A clip contributes only if its sequence contains a join. Short clips are excluded at larger windows.
There is no universal monotonic threshold: changing window length also moves the joins onto different audio content, and decoder context is reset at each call. Reported pass/fail brackets are measured ranges, not interpolated guarantees. A passing pooled mean does not guarantee that every clip or dataset passes.
Confidence intervals are pointwise exploratory intervals for this fixed sample; they are not simultaneous coverage guarantees across all adaptive comparisons. The metrics describe spectral error, and no listener test or ASR metric was used to interpret these window thresholds.
What the S2-Pro architecture tells us
The pinned S2-Pro configuration includes an eight-layer causal transformer after code lookup, with a 128-frame attention window per layer, followed by upsampling and a waveform decoder with four transformer layers. At 21.53 code frames per second, 128 code frames represent about 5.94 seconds; stacking layers can extend the effective history beyond that per-layer window. An independent decoder call starts a new sequence, so it loses the preceding codes as attention context.
This is a plausible mechanism for the measured S2-Pro sensitivity to short windows. The experiment compares complete inference paths and does not isolate architecture from training. Its thresholds apply to decoding independent code windows using the documented hard-join policy.
Local source evidence: vendor/fish-speech/fish_speech/configs/modded_dac_vq.yaml, models/dac/rvq.py:DownsampleResidualVectorQuantize.decode, and models/dac/modded_dac.py:DAC.from_indices, under the pinned Fish source revision in the protocol.
Exact experiment and metric definitions
Each source is encoded once as a complete clip. The same integer code tensor is decoded in one call for
the control and then in contiguous independent windows. Equal-length windows may be batched, while each
batch row remains an independent sequence. The final short window is retained. Waveforms are concatenated
at hard joins and trimmed to source duration; no overlap, crossfade, decoder state, delay correction, or
loudness adjustment is used.
All metrics use sample-zero aligned 24 kHz mono audio. The mel transform uses 80 Slaney magnitude bands,
Slaney area normalization, a 1024-sample periodic Hann window, 256-sample hop, 0–12 kHz range, centered
constant-padded STFT, and epsilon 10⁻⁵.
- Log-mel L1: mean |ln(Msource + 10⁻⁵) − ln(Mdecode + 10⁻⁵)|.
- Log1p-mel L1: mean |ln(1 + Msource) − ln(1 + Mdecode)|. No epsilon or rescaling is added.
It weights low-amplitude differences less than log-mel and remains sensitive to the input amplitude scale.
- MR-STFT: mean over FFT sizes 512, 1024, 2048 of spectral convergence plus log-magnitude L1.
Each hop is FFT/4, with centered constant padding and periodic Hann window. Spectral convergence is
||Ssource − Sdecode||F / max(||Ssource||F, 10⁻⁵); log-magnitude L1 uses ln(S + 10⁻⁵).
Relative increase: 100 × (mean treatment error / mean matched baseline error − 1).
Negative values are retained. Ten thousand paired clip resamples form the percentile 95% interval.
The initial broad sweep is followed by integer refinement of pooled threshold brackets; ranges that
remain unsampled are reported explicitly.
Reproducibility and artifacts
The measured output contains 37,200 clip/window conditions. Experiment execution took 42.7 minutes of cumulative measured session wall time, including the inherited three-codec experiment but excluding idle time between extensions, on NVIDIA L40S with Torch 2.12.0+cu130. CUDA timings here describe total experiment execution, including metric work; they are not decoder throughput. Source tensors and full-control metrics are checked for consistency when resuming; cached discrete codes are retained under codes/.
Reproduce the experiment and both report formats from the repository root. The experiment resumes recorded conditions and reuses cached codes.
.venv/bin/python scripts/benchmark_decoder_degradation.py
.venv/bin/python scripts/validate_decoder_degradation.py
.venv/bin/python scripts/decoder_degradation_spectrograms.py
.venv/bin/python scripts/report_decoder_degradation.py
node scripts/export_decoder_degradation_pdf.mjs
Files include selected_clips.csv, protocol.json, per_clip.jsonl, per_clip.csv, aggregate.csv, thresholds.csv, and report.json.
| Codec | Checkpoint revision | Measured SHA-256 |
|---|
| Descript DAC | 0.0.1 | a88eed82a7024ccc1facdb1e605c4c2f99281c8118c22c9895ffa846d8fb61aa |
| Fish 400M MorePitchLoss1 | step3802000-generator-20260915 | a97c5ebe1cbfcd0a341e268de5a31b42b1daac4d64741a25687ae271c3c94321 |
| Fish DAC S2-Pro | 1de9996b6be38b745688de084d87a5633f714e4e | 74fc41c5a7151c6f350af8bd7e5d6e3accfcc7f3dfbfac23afd35af07052bb2f |
| Qwen3-TTS 12Hz | 7dd38ad4e9bad454aae9cd937d0cd577604fe229 | 836b7b357f5ea43e889936a3709af68dfe3751881acefe4ecf0dbd30ba571258 |